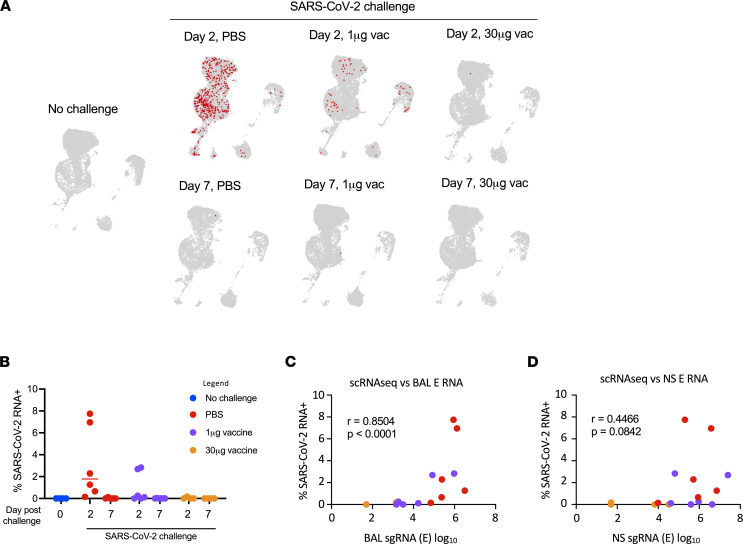
Figure 3. Identification and quantification of SARS-CoV-2 RNA+ cells.
(A) Location of SARS-CoV-2 RNA+ cells. (B) Frequency of SARS-CoV-2 RNA+ cells. (C) Relationship between BALF RNA load and frequency of SARS-CoV-2 RNA+ cells. (D) Relationship between NS RNA load and frequency of SARS-CoV-2 RNA+ cells. Spearman’s correlation was used to assess significance.

