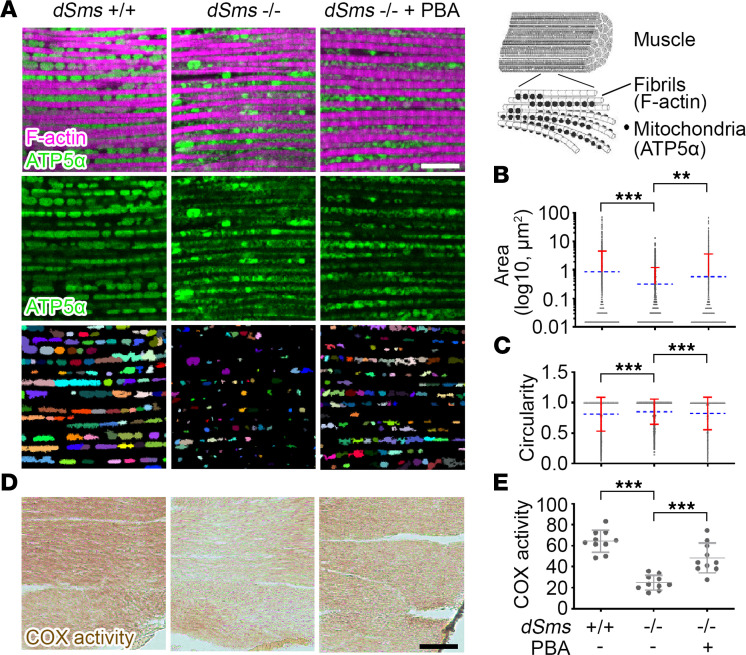
Figure 3. PBA treatment partially restores mitochondria in a Drosophila SRS model.
(A) Mitochondrial membrane protein ATP5α and contractile filament component F-actin staining of flight muscle of 10 DAE flies with or without PBA feed. The third row shows recognized mitochondria by automatic segregation of ATP5α staining signal using ImageJ H-watershed (NIH). The images are representatives of 5 flies in each group. Scale bar: 10 μm. The diagram of muscle fiber structure on the top right is adapted from (97). (B) Quantification of mitochondrial size indicated by segregated ATP5α signal. Each mitochondrion is marked as a dot. Multiple dots of mitochondria with the same size aggregate into a black line. The blue dash lines indicate the average values. The red bars indicate SD. (C) Quantification of mitochondrial shape indicated by circularity of segregated ATP5α signal. Each mitochondrion is marked as a dot. Multiple dots of mitochondria with the same circularity aggregate into a black line. The blue dash lines indicate the average values. The red bars indicate SD. (D) COX activity staining of flight muscle of 10 DAE flies with or without PBA feed. The image is a representative of 10 samples in each group. Scale bar: 50 μm. (E) Quantification of COX activity in D. n = 10; **P < 0.01, ***P < 0.001; ordinary 1-way ANOVA multiple comparisons in B, C, and E. Data represent mean ± SEM.

