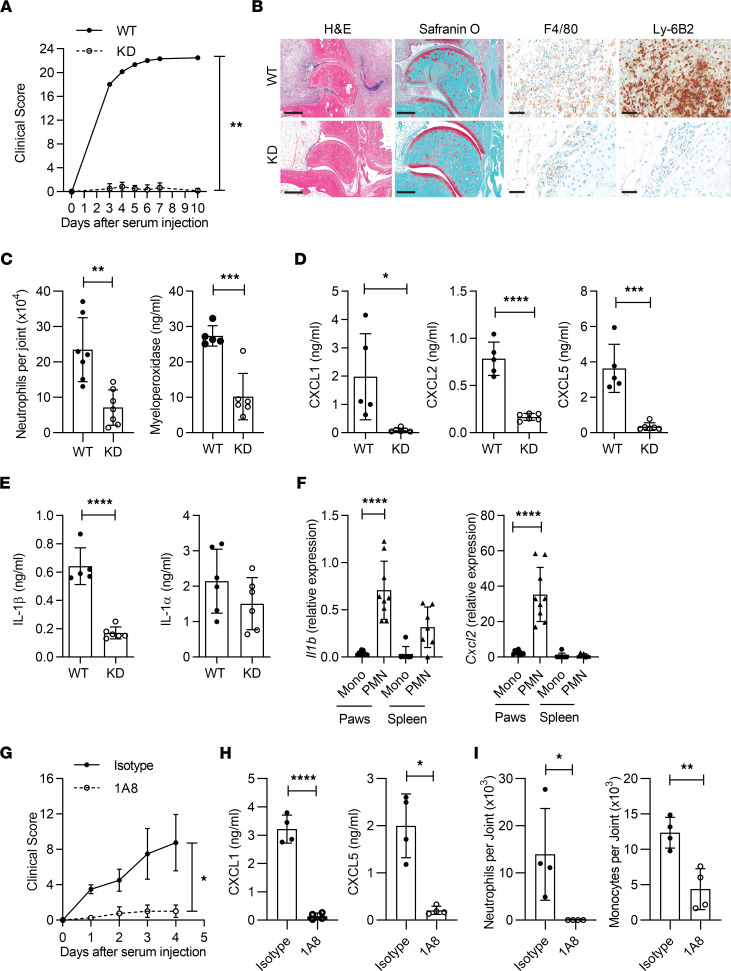
Figure 3. K/BxN arthritis depends on IRAK1-dependent neutrophil recruitment to joints.
(A) Clinical scores. Data points represent means ± SEM of n = 6 mice per group. (B) Representative histology of WT and IRAK1KD joints on day 7. Scale bar: H&E, 500 μm; Safranin O, 300 μm; F4/80 and Ly-6B2, 50 μm. (C) Neutrophil numbers and MPO expression in ankle joints, means ± SD. (D and E) Cytokine levels in paw homogenates, means ± SD. Data in A–E are representative of 2 independent experiments. (F) Monocytes (Mono) or neutrophils (PMN) were isolated from inflamed joints or spleens from WT and IRAK1KD animals at day 4 and analyzed for Il1b and Cxcl2 expression, means ± SD. Pooled data from 3 experiments. (G) Clinical scores in neutrophil-depleted (1A8) or isotype-treated animals. Data points represent means ± SEM of n = 4 mice per group. (H) Levels of CXCL1 and CXCL5 in paw homogenates at day 4, means ± SD. (I) Neutrophil and monocyte numbers in ankle joints at day 4, means ± SD. Data in G–I are representative of 2 independent experiments. Data points in C–F, H, and I represent individual mice. Paired t test (A and G), unpaired t test (C–E, H, I), 1-way ANOVA, Bonferroni’s posttest (F). *P < 0.05, **P < 0.01, ***P < 0.001, ****P < 0.0001.

