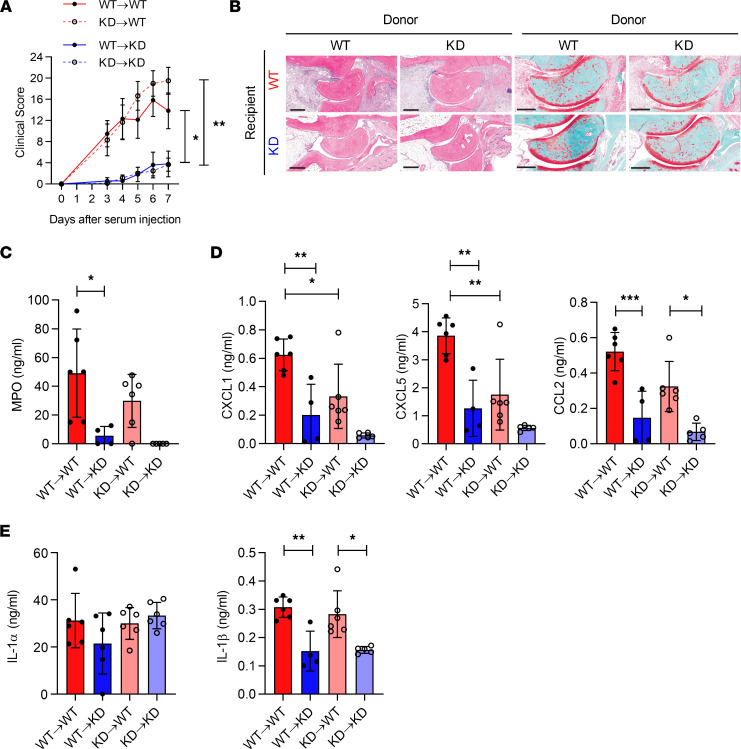
Figure 4. K/BxN arthritis in mixed reciprocal bone marrow chimeras of WT or IRAK1KD mice.
(A) Clinical index over time; data points represent means of n = 6 mice ± SEM. (B) Representative H&E staining of joints at day 7. Scale bar H&E, 400 μm; Safranin O, 300 μm. (C) MPO, (D) CXCL1, CXCL5, CCL2, (E) IL-1α, and IL-1β in joints at day 7. Data points in C–E represent individual mice, means ± SD. One representative of 2 independent experiments. One-way ANOVA with Bonferroni’s posttest. *P < 0.05, **P < 0.01, ***P < 0.001.

