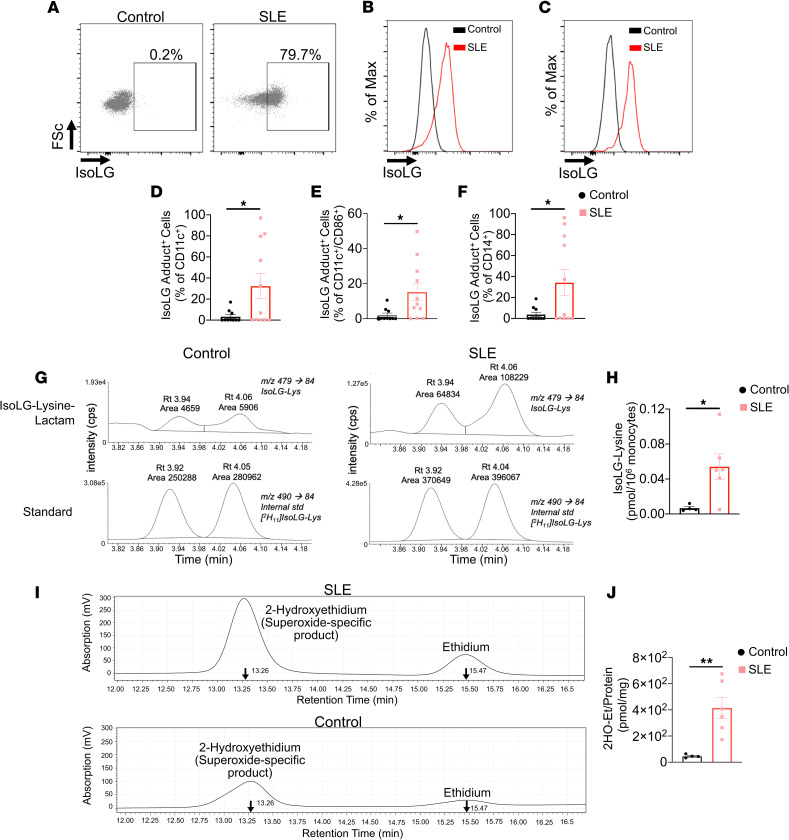
Figure 1. IsoLG adducts are enriched in monocytes of patients with SLE.
(A) Representative FACS plots displaying isoLG adduct containing CD11c+ PBMCs from a representative control and patient with SLE. Representative histograms displaying the distribution of isoLG adducts in (B) CD11c+ and (C) CD11c+CD86+ cells. Quantitation of IsoLG adduct–containing cells as a percentage of (D) CD11c+, (E) CD11c+CD86+, and (F) CD14+ cells. For B–F data were analyzed using 1-tailed Student’s t test or Mann-Whitney U test (n = 10–11, *P < 0.05). (G) Stable isotope dilution multiple reaction monitoring for mass spectrometry analysis of isoLG-lysine-lactam adduct in DCs. Representative liquid chromatography/mass spectrometry chromatographs from a representative patient. The top row shows multiple reaction monitoring chromatographs for isoLG lysine lactam in samples, while the bottom row shows multiple reaction monitoring chromatograph for [13C615N2] internal standard for the same samples. cps, counts per second; Rt, retention time. (H) Quantitation of isoLG-lysine in monocytes from a subset of SLE patients and controls. (I) Monocytes from SLE patients and controls were sorted. Superoxide was detected using HPLC to monitor conversion of dihydroethidium to the superoxide oxidation adduct 2-hydroxyethidium (2-HO-ET) and ethidium. (J) Quantitation of 2-HO-ET from SLE patients and controls. For H and J, comparisons were made with a 1-tailed Student’s t test (n = 4–6, *P < 0.05, **P < 0.01).

