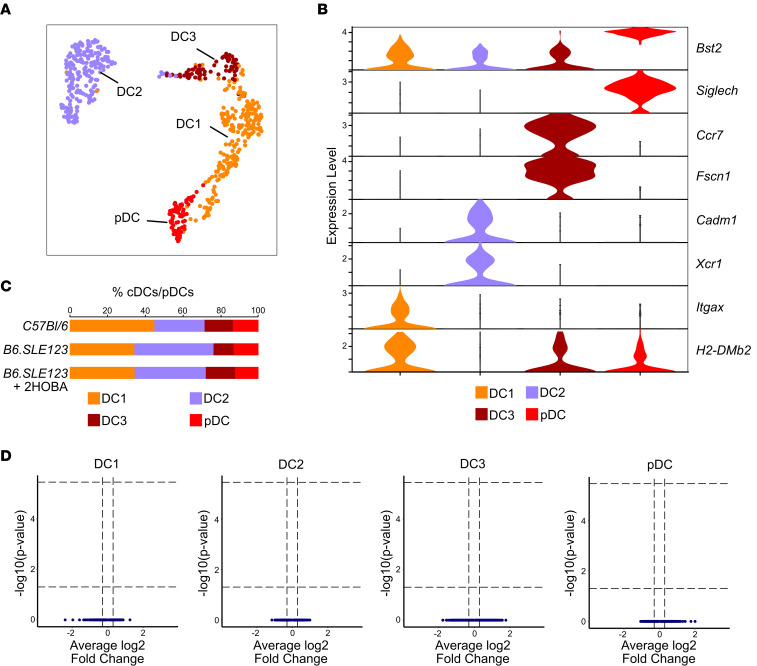
Figure 14. No significant differential gene regulation is identified in classical and pDCs in B6.SLE123+2-HOBA versus B6.SLE123 mice.
DCs were subclustered into DC1, DC2, DC3, and pDC. (A) Uniform manifold approximation and projection of DC clusters. (B) Violin cluster of markers for individual DC clusters. (C) DC clusters represented as a percentage of total cDCs/pDCs. (D) Volcano plots identifying differentially expressed genes in the DC clusters between B6.SLE123+2-HOBA and B6.SLE123 mice.

