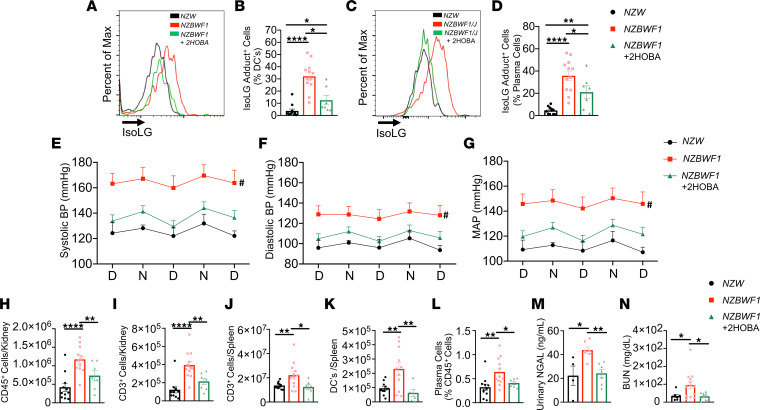
Figure 9. IsoLG scavenging reduces blood pressure and systemic autoimmunity in the NZBWF1 mouse model of SLE.
Animals were sacrificed at 32 weeks, and single-cell suspensions were prepared from the spleen, kidney, and bone marrow and analyzed by flow cytometry. (A) Representative histogram displaying the distribution of IsoLG adduct–containing splenic DCs. (B) Quantitation of IsoLG adduct–containing splenic DCs. (C) Representative histogram displaying the distribution of IsoLG adduct–containing bone marrow plasma cells. (D) Quantitation of IsoLG adduct–containing bone marrow plasma cells. Radiotelemeters were implanted in 30-week-old mice. Blood pressure was measured over a 3-day period prior to sacrifice at 32 weeks old. Day and night cycles are represented for (E) systolic, (F) diastolic, and (G) mean arterial pressures. Flow cytometry was performed for quantitation of (H) kidney CD45+ and (I) kidney CD3+ T cells, (J) splenic CD3+ T cells, (K) splenic DCs, and (L) bone marrow plasma cells. (M) Urinary NGAL and (N) BUN were quantitated by ELISA. Data from B, D, and H–M were analyzed by 1-way ANOVA or Brown-Forsythe and Welch ANOVA (n = 7–12, *P < 0.05, **P < 0.01, ****P < 0.0001). Blood pressure was analyzed using 2-way ANOVA (n = 5–9, #P < 0.001 NZBWF1 vs. NZBWF1 + 2-HOBA).

