
Figure 3.
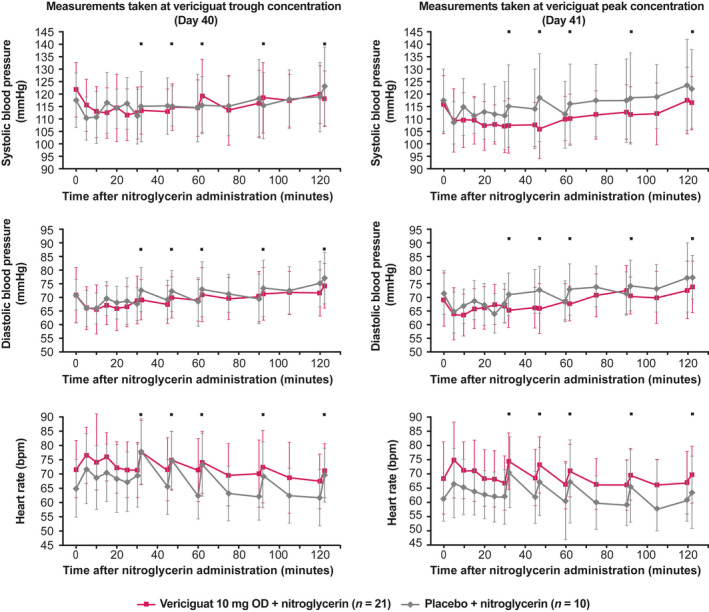
Hemodynamics after nitroglycerin administration with vericiguat 10 mg OD or placebo. Left panel, at trough concentration; right panel, at peak concentration. Data are presented as mean and standard deviation and represent measurements made when vericiguat had reached steady state. Measurements were taken in the seated position unless indicated otherwise. ⬛, measurements were taken in the standing position. bpm, beats per minute; OD, once daily. [Colour figure can be viewed at wileyonlinelibrary.com]