
FIGURE 1.
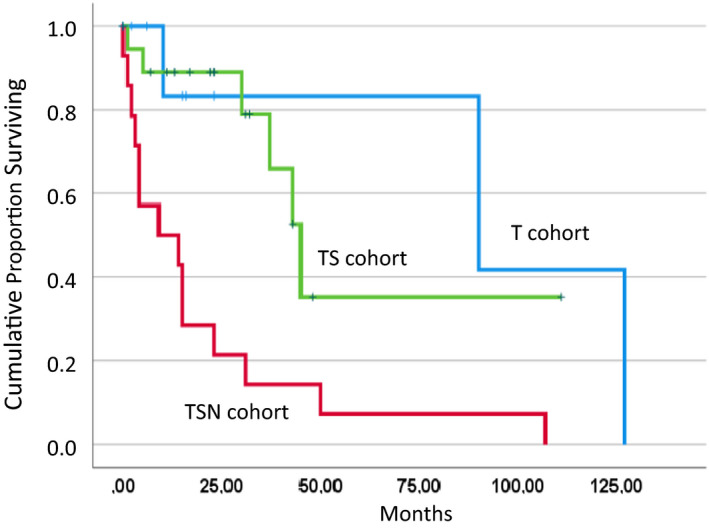
Overall survival indicated by Kaplan‐Meier plots in three distinct molecularly defined CMML cohorts including TET2 monomutated patients (T, n = 10), TET2/SRSF2 bimutated patients (TS, n = 19), and patients who had NRAS mutations in addition to TET2/SRSF2 comutations (TSN, n = 14)