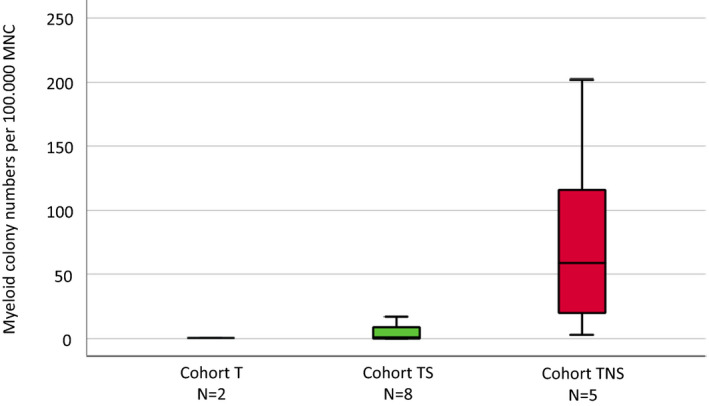
FIGURE 3.

Box plots showing the distribution of spontaneous colony numbers in the three patient cohorts including median values, minimum values, and maximum values, respectively. Cultures were plated in duplicates at 25–100 × 103 PBMNC/ml. Aggregates with more than 40 translucent, dispersed cells were counted as CFU‐GM. CFU‐GM data from patients are expressed as mean values from cultures
