Figure 1.

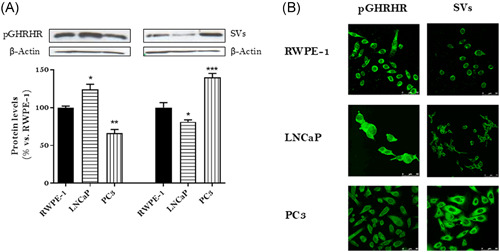
Expression and subcellular location of GHRH receptors in RWPE‐1, LNCaP and PC3 cells. (A) Expression levels of GHRH receptors were evaluated by Western blotting using specific antibodies for pGHRHR and SVs. The diagram represents the mean ± SEM of four experiments. *p < 0.05; **p < 0.01; ***p < 0.001 compared with those obtained in RWPE‐1 cells. (B) Immunofluorescence detection of pGHRHR and SVs. Cells were fixed and incubated with anti‐pGHRHR and anti‐SVs as described in Section 2.2. After an examination by confocal microscopy, the intensity of the emitted fluorescence was measured using image performing software LCS‐SL. Results are representative of four independent experiments. Cells were observed at ×200 magnification, scale bar = 20 μm. GHRH, growth hormone‐releasing hormone; SV, splice variant [Color figure can be viewed at wileyonlinelibrary.com]
