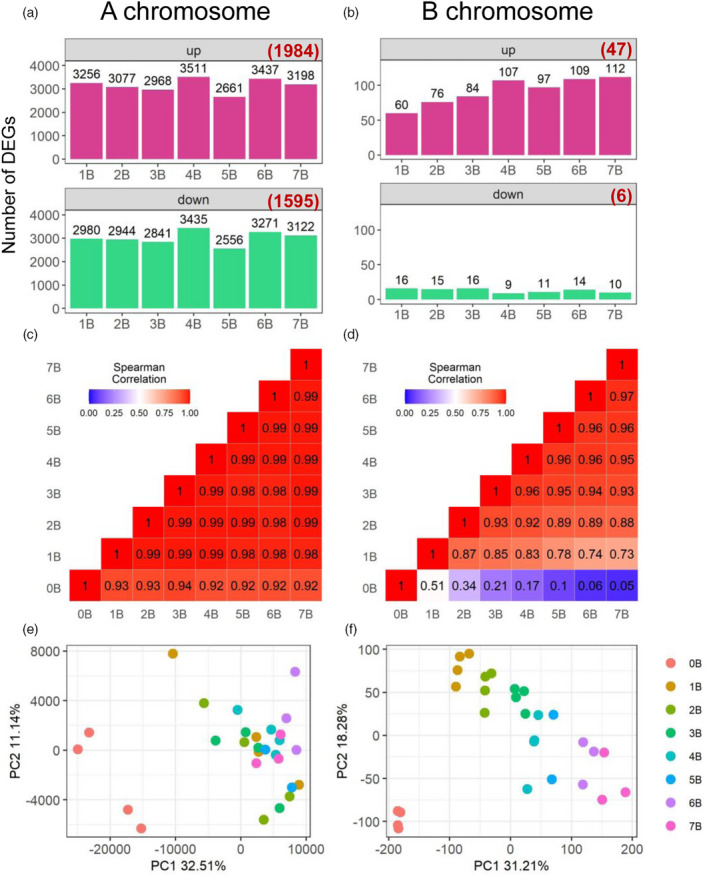
Figure 2.

Expression patterns of A‐located genes and B‐located genes. (a, b) Number of A‐located (a) and B‐located (b) differentially expressed genes (DEGs). DEGs were determined as described in the ‘Experimental Procedures’ section. Numbers in brackets represent DEGs in all seven comparisons. (c, d) Heatmap of pairwise correlation (Spearman) matrix between the gene expression level of plants from one experimental or control condition to another. The Spearman correlation coefficient (SCC) was produced by comparing normalized read counts of A‐located genes (c) or B‐located genes (d) averaged across all biological replicates in one genotype to those in another genotype (e.g., 0B versus 1B). The number in each box represents the SCC in the pairwise comparison between two genotypes on the x‐ and y‐axes. The color scale level of each box is reflected by the value of SCC as shown in the color scale bar in the top left corner. (e, f) PCA plots of the expression levels of A‐located genes (e) and B‐located genes (f).
