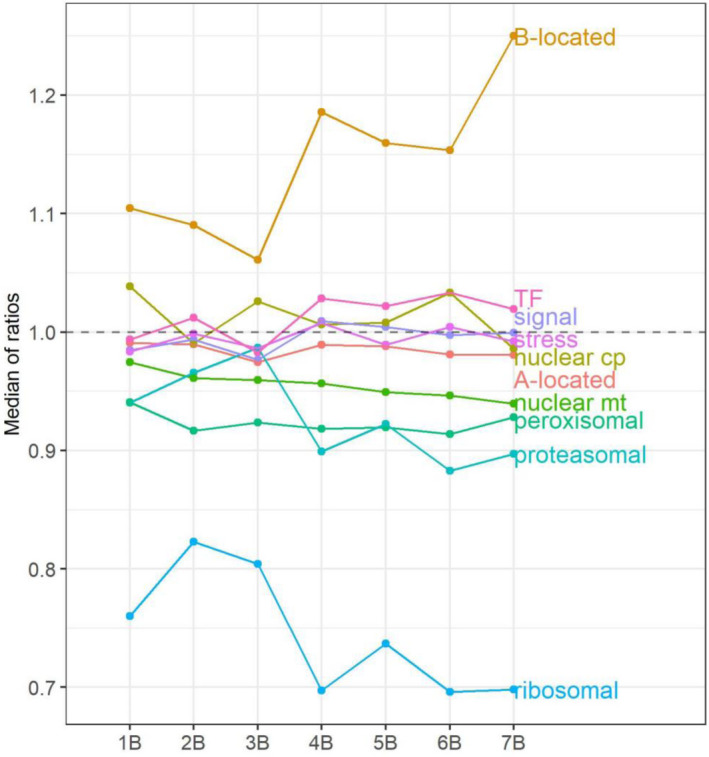
Figure 4.

Median of ratios of A‐ and B‐located genes, and each functional class of A‐located genes. The x‐axis refers to the B copy number of the experimental group, whereas the y‐axis denotes the median of ratios in each distribution (Figures 1 and 5; Figures S7–S13), computed as in Table S2.
