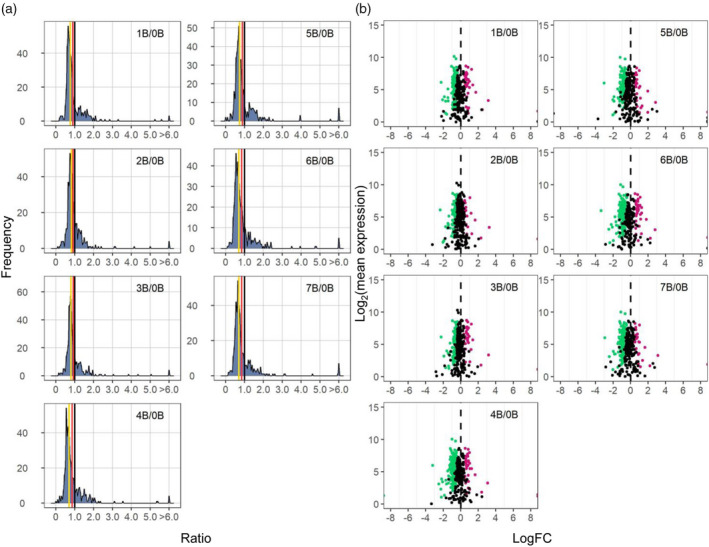
Figure 5.

Ratio distributions and scatter plots for the functional class of structural components of the ribosome. (a) Ratio distributions of structural components of the ribosome, generated as described in Figure 1. (b) Scatter plots of structural components of the ribosome. The x‐axis represents the log2(fold change) values of each experimental genotype to the control, whereas the y‐axis denotes the mean of normalized counts of each experimental genotype and the control. Data points with q < 0.05 and a corresponding log(FC) >0 are depicted in magenta, while points with q < 0.05 and a corresponding log(FC) <0 are depicted in green. Otherwise, they are shown in black. A ratio of 0 represents no change (black vertical dashed line).
