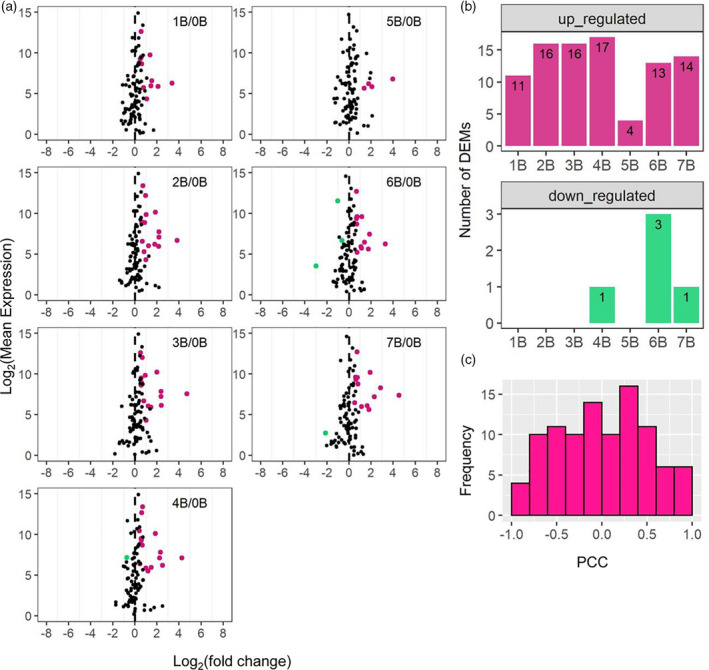
Figure 6.

Scatter plots of A‐located miRNAs, the number of differentially expressed miRNAs (DEMs), and histograms of Pearson correlation coefficients (PCCs). (a) Scatter plots of A‐located miRNAs. Significance (false discovery rate [FDR] < 0.05) was determined by edgeR. Otherwise, plots were generated as in Figure 5b. (b) The number of A‐located DEMs determined as in (a). (c) Histogram of PCCs of A‐located miRNAs plotted as in Figure 3.
