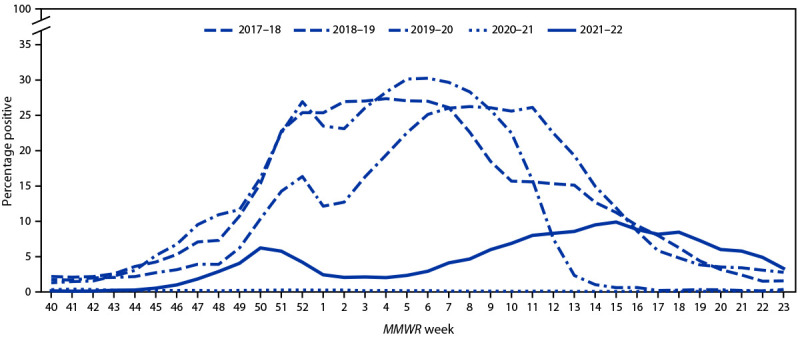
FIGURE 1.

Influenza-positive test results reported by clinical laboratories to CDC, by MMWR week and influenza season — United States, October–June, 2017–18 to 2021–22

Influenza-positive test results reported by clinical laboratories to CDC, by MMWR week and influenza season — United States, October–June, 2017–18 to 2021–22