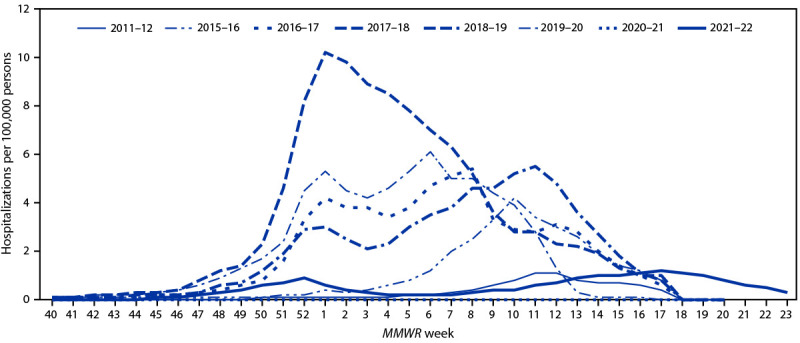
FIGURE 2.

Weekly rate* of hospitalizations among patients of all ages with laboratory-confirmed influenza — United States, October–June, 2011–12 and 2015–16 to 2021–22
* Weekly rates for all seasons before the 2021–22 season reflect end-of-season rates. For the 2021–22 season, rates for recent hospital admissions are subject to reporting delays. As hospitalization data are received each week, case counts and rates are updated accordingly. Because of late season activity during the 2021–22 season, the Influenza Hospitalization Surveillance Network has extended surveillance beyond the typical end date of April 30 (MMWR week 17).
