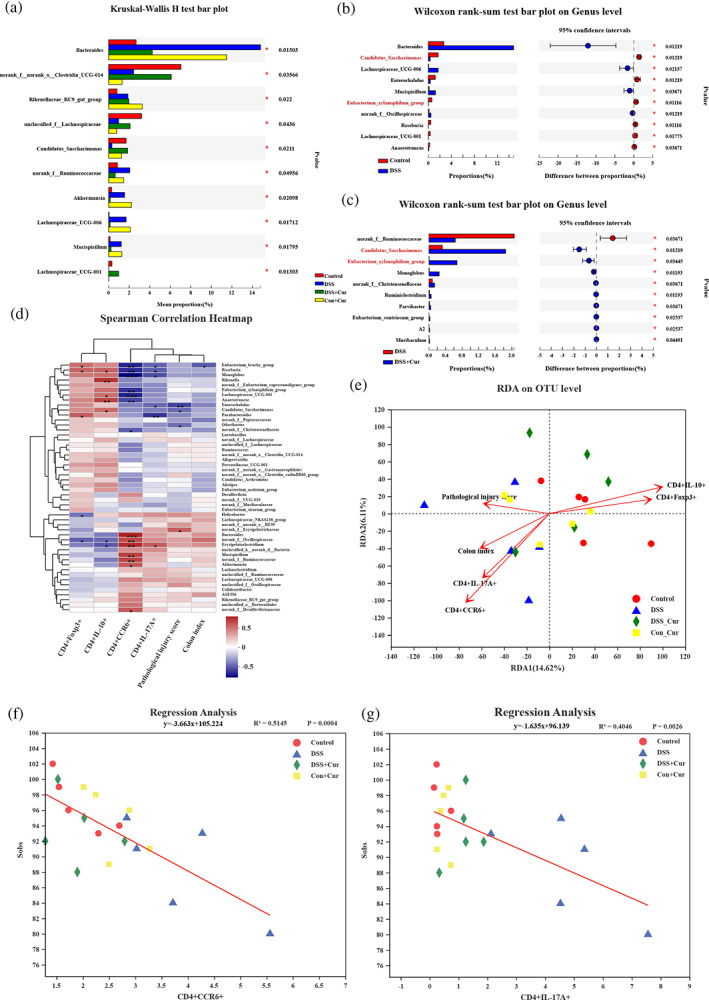
FIGURE 7.

Species differences in intestinal microbiota and correlation analysis. (a) Differential analysis among these four groups at the genus level; (b) Phylotypes significantly different between Control and DSS groups at genus level; (c) Phylotypes significantly different between DSS and DSS + Cur groups at genus level; (d) Spearman's correlation heatmap of CD4+Foxp3+, CD4+IL‐10+, CD4+CCR6+, CD4+IL‐17A+, pathological injury score, colon index, and intestinal microbiota. (e) Linear regression analysis of relationship between CD4+IL‐17A+Th17 and gut microbiota. (f) Linear regression analysis of relationship between CD4+CCR6+Th17 and intestinal microbiota, n = 5
