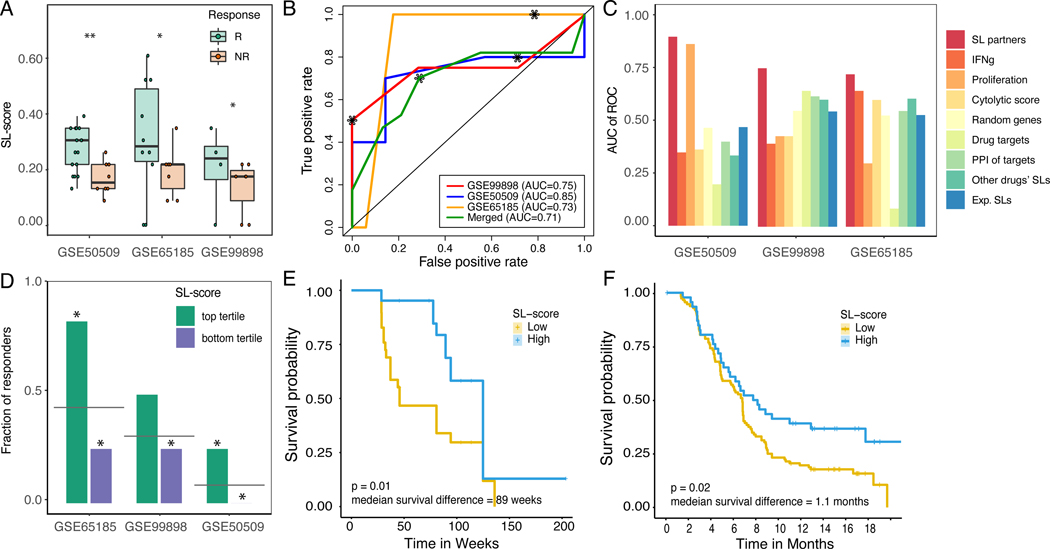
Figure 2. SELECT stratifies melanoma patients for BRAF inhibitors based on the expression of BRAF SL partners.
(A) SL-scores are significantly higher in responders (green) vs non-responders (red) based on Wilcoxon rank-sum test after multiple hypothesis correction. For false discovery rates: * denotes 10% and ** denotes 5%. (B) ROC curves depicting the prediction accuracy of the response to BRAF inhibition using SL-scores in the three melanoma cohorts (red, yellow, blue) and their aggregation (green). The stars denote the point of the maximal Fl-score. (C) Bar graphs show the predictive accuracy in terms of Area Under the Curve (AUC) of ROC curve (Y-axis) of SL-based predictors (red) and controls including several known transcriptomics-deduced metrics (IFNg signature, proliferation index, cytolytic score, and the drug target expression levels) and several interaction-based scores (based on randomly chosen partners, randomly chosen PPI partners of the drug target gene(s), the identified SL partners of other cancer drugs, and experimentally identified SL partners) in the three BRAF inhibitor cohorts (X-axis). (D) Bar graphs showing the fraction of responders in the patients with high SL-scores (top tertile; green) and low SL-scores (bottom tertile; purple). The grey line denotes the overall response rate in each cohort, and the stars denote the hypergeometric significance of enrichment of responders in the high-SL group and depletion of responders in the low-SL group (compared to their baseline frequency in the cohort). (E,F) Kaplan-Meier curves depicting the survival of patients with low (yellow) vs high (blue) BRAF SL-scores (top vs. bottom tertile of SL-scores) of (E) GSE50509 (Rizos et al., 2014) and (F) independent (unseen) BRAF inhibitor clinical trials (Wongchenko et al., 2017). Patients with high SL-scores show better prognosis, as expected. The logrank P-value and median survival difference are denoted. See also Supplemental Figure 2,3, Supplemental Table 2,5.

