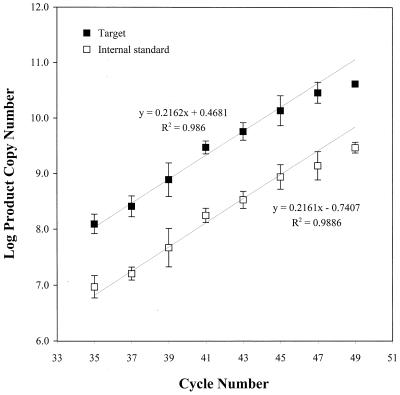
FIG. 4.
Comparison of amplification efficiencies in Eel Pond seawater of C. roenbergensis and internal competitor DNA as a function of PCR cycle number (two-stage amplification). PCR products were quantified by integrating the target and internal competitor DNA peaks and multiplying the ratios of the target to total peak area and primer to total peak area by the concentration (copies per microliter) of primer used in the PCR. The error bars represent the standard deviation of the mean of quadruple measurements. Linear regressions were performed on data points from cycles 35 to 45.

