
FIGURE 1.
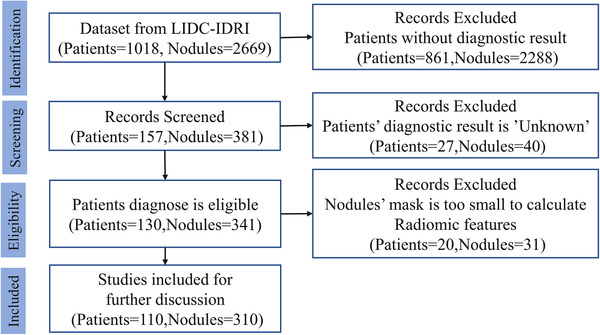
Sample selection flowchart describing the number of subjects and the number of nodules selected for this analysis
Official websites use .gov
A
.gov website belongs to an official
government organization in the United States.
Secure .gov websites use HTTPS
A lock (
) or https:// means you've safely
connected to the .gov website. Share sensitive
information only on official, secure websites.
Sample selection flowchart describing the number of subjects and the number of nodules selected for this analysis