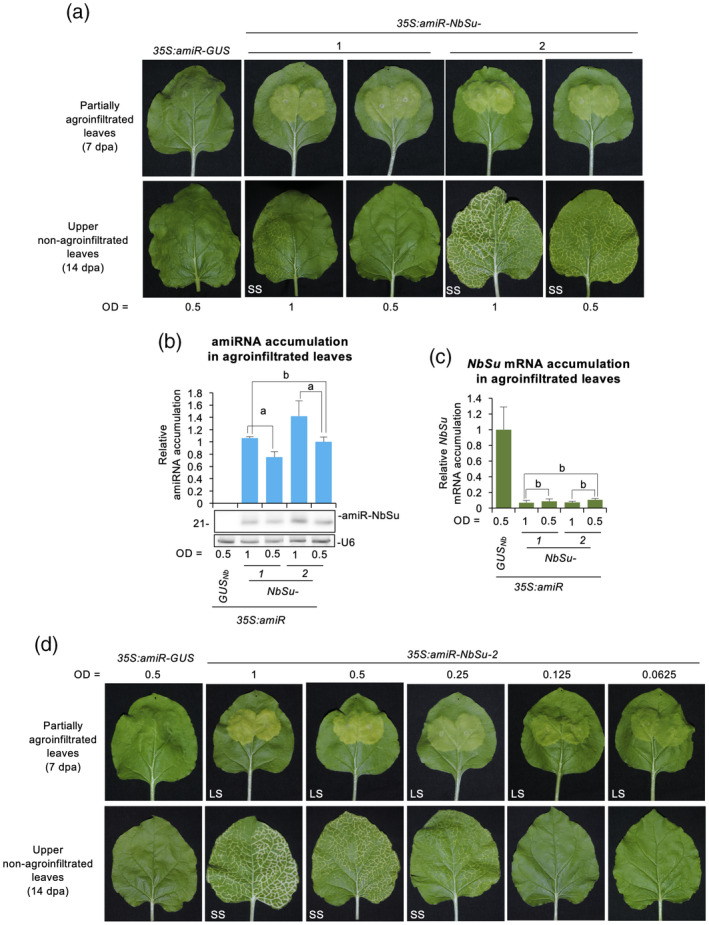
Figure 4.

Effects of amiRNA expression level on systemic silencing induction. (a) Photographs of partially agroinfiltrated leaves at 7 days post‐agroinfiltration (dpa) (top) and of upper non‐agroinfiltrated leaves at 14 dpa (bottom). amiRNA constructs were agroinfiltrated to a final optical density (OD) of 1 or 0.5, as indicated. Other details are as shown in Figure 2(a). (b) Northern blot detection of amiR‐NbSu amiRNAs in RNA preparations from agroinfiltrated leaves at 2 dpa. amiRNA constructs were agroinfiltrated to a final OD of 1 or 0.5, as indicated. The graph at top shows the mean ± SD (n = 3) amiR‐NbSu relative accumulation (35S:amiR‐NbSu‐1 = 1.0). Bars with the letter ‘a’ are significantly different from that of sample 35S:amiR‐NbSu‐2 at OD = 0.5, whereas the bar with the letter ‘b’ is not. Other details are as shown in Figure 1(b). (c) Accumulation of NbSu mRNA in agroinfiltrated leaves. Mean ± SE relative level (n = 3) of NbSu mRNAs after normalization to PROTEIN PHOSPHATASE 2A (PP2A), as determined by quantitative RT‐PCR (qPCR) [35S:amiR‐GUS Nb (OD = 0.5) = 1.0 in all comparisons]. Other details are as shown in Figure 1(b). (d) Photographs of partially agroinfiltrated leaves at 7 dpa (top) and of upper non‐agroinfiltrated leaves at 14 dpa (bottom). amiRNA constructs were agroinfiltrated to a final OD of 1, 0.5, 0.25, 0.125 or 0.0625, as indicated. Other details are as shown in Figure 2(a). [Colour figure can be viewed at wileyonlinelibrary.com]
