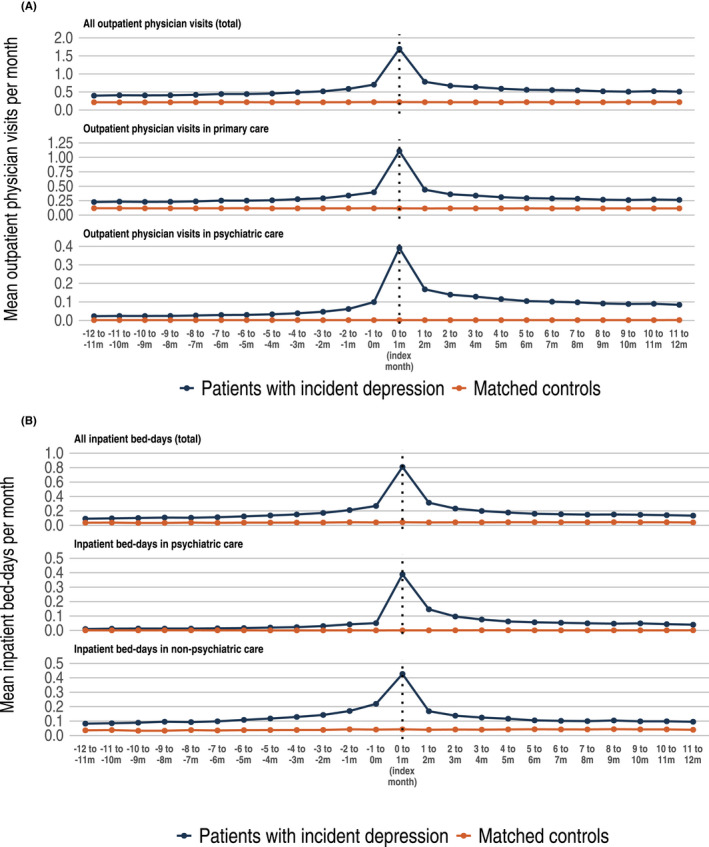
FIGURE 3.

Healthcare resource utilization among patients with incident MDD compared with matched study population controls. (A) The mean number of outpatient physician visits per months from 12 months before index up to 12 months after index. Upper panel: mean number of outpatient physician visits in any healthcare level (total). Middle panel: mean number of outpatient physician visits in primary care. Lower panel: mean number of outpatient physician visits in psychiatric care. (B) The mean number of inpatient bed days per months from 12 months before index up to 12 months after index. Upper panel: mean number of inpatient bed days in any health care (total). Middle panel: mean number of inpatient bed days in psychiatric care. Lower panel: Mean number of inpatient bed days in non‐psychiatric care. Please note that the y‐axis has different scales
