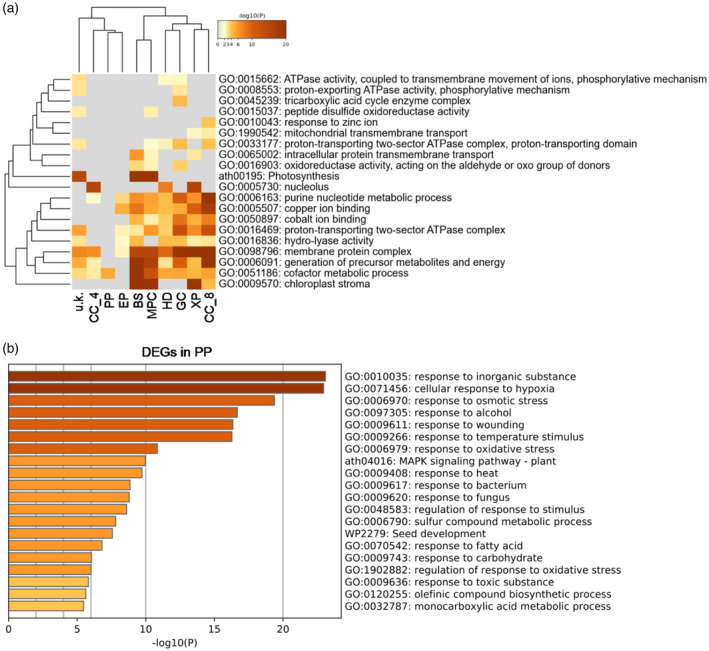
Figure 2.

Gene Ontology (GO) enrichment analysis of the differentially expressed genes (DEGs) in each of the cell clusters.
(a) Analysis of the specifically enriched GO terms in each cell cluster. BS, bundle sheath; MPC, mesophyll cell; PP, phloem parenchyma; HD, hydathode; CC, companion cell; GC, guard cell; EP, epidermis; XP, xylem parenchyma; u.k., unknown.
(b) Analysis of the specifically enriched GO terms in PP.
