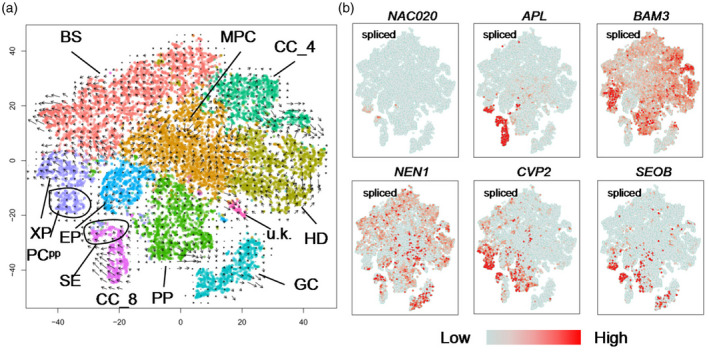
Figure 6.

RNA velocity unveils the RNA dynamics of different cell types.
(a) RNA velocity plotted in t‐distributed Stochastic Neighbor Embedding (t‐SNE) space. The direction of state transitions and the extent of change in RNA dynamics are indicated by the vectors (arrows) and their lengths, respectively. Long arrows indicate that cells have either initiated or terminated the transcription of many different genes, while short arrows or no arrows indicate cells with small changes in transcriptional activity.
(b) The plots illustrate phase portraits of representative genes. The signals of spliced mRNA were shown.
