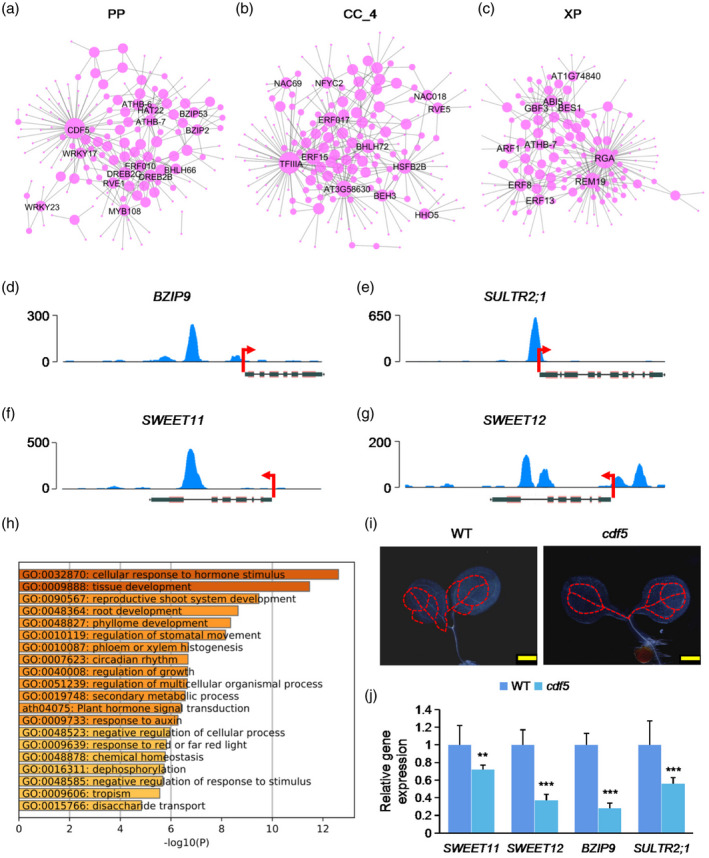
Figure 7.

Identification of regulatory networks of transcription factors (TFs) in different cell types.
(a−c) Regulatory network showing potentially core transcriptional regulators for phloem parenchyma (PP), companion cell (CC)_4 and xylem parenchyma (XP) cells. The dot size indicates the number of connections. Gene names of top‐ranked nodes (ranked by the number of connections) are shown.
(d−g) DNA affinity purification sequencing (DAP‐seq) of enrichment of CDF5 in the promoter regions of representative genes. Data are derived from O’Malley et al. (2016).
(h) Gene Ontology (GO) enrichment analysis of target genes of CDF5.
(i) Detection of the developmental patterns of vascular system in cotyledons of 3‐day‐old seedlings of cdf5 mutant and wild‐type (WT) seedlings. Scale bar: 500 μm.
(j) Quantitative polymerase chain reaction (qPCR) analysis of the relative expression of representative target genes of CDF5 in cdf5 mutant and WT. **p < 0.01; ***p < 0.001, Student’s t‐test versus WT.
