
FIGURE 3.
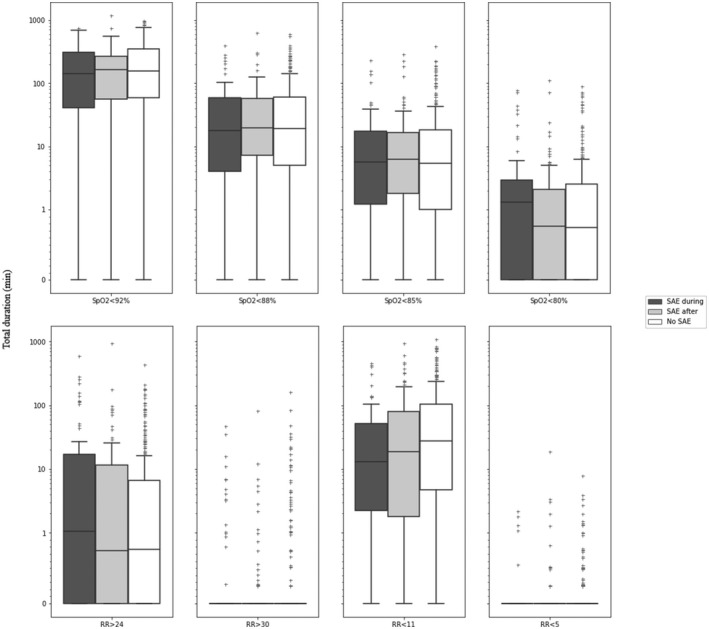
Duration of preceding respiratory vital sign abnormalities in patients with a serious adverse event during monitoring, after monitoring, and patients without any SAE. Boxplots lower box = 25th percentile, median bar = median, upper box = 75th percentile, whiskers 5’th and 95’th percentile, and outliers. SpO2: Peripheral oxygen saturation (%). RR: Respiratory rate per min; SAE: Serious adverse event; SAE‐during: Patient group with SAE occurring during monitoring; SAE‐after: Patient group with SAE occurring after monitoring; No‐SAE: Patient group without experiencing any SAE; Y‐axis: Duration (min)