
Figure 6.
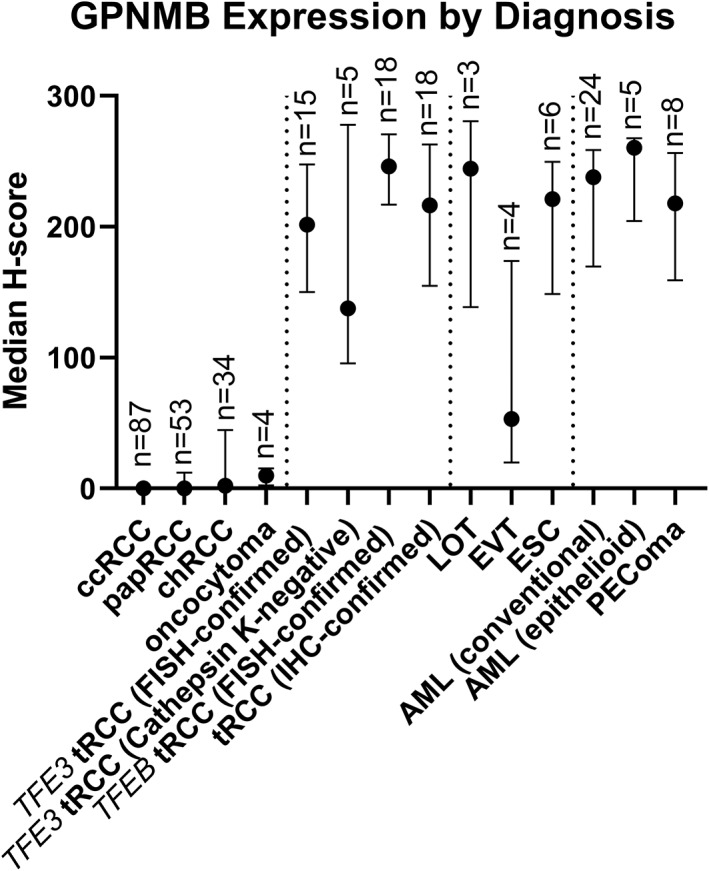
Digitally quantified GPNMB expression by renal tumor diagnosis. The point represents the median H‐score, and bars represent the interquartile range for each diagnostic group.
Official websites use .gov
A
.gov website belongs to an official
government organization in the United States.
Secure .gov websites use HTTPS
A lock (
) or https:// means you've safely
connected to the .gov website. Share sensitive
information only on official, secure websites.
Digitally quantified GPNMB expression by renal tumor diagnosis. The point represents the median H‐score, and bars represent the interquartile range for each diagnostic group.