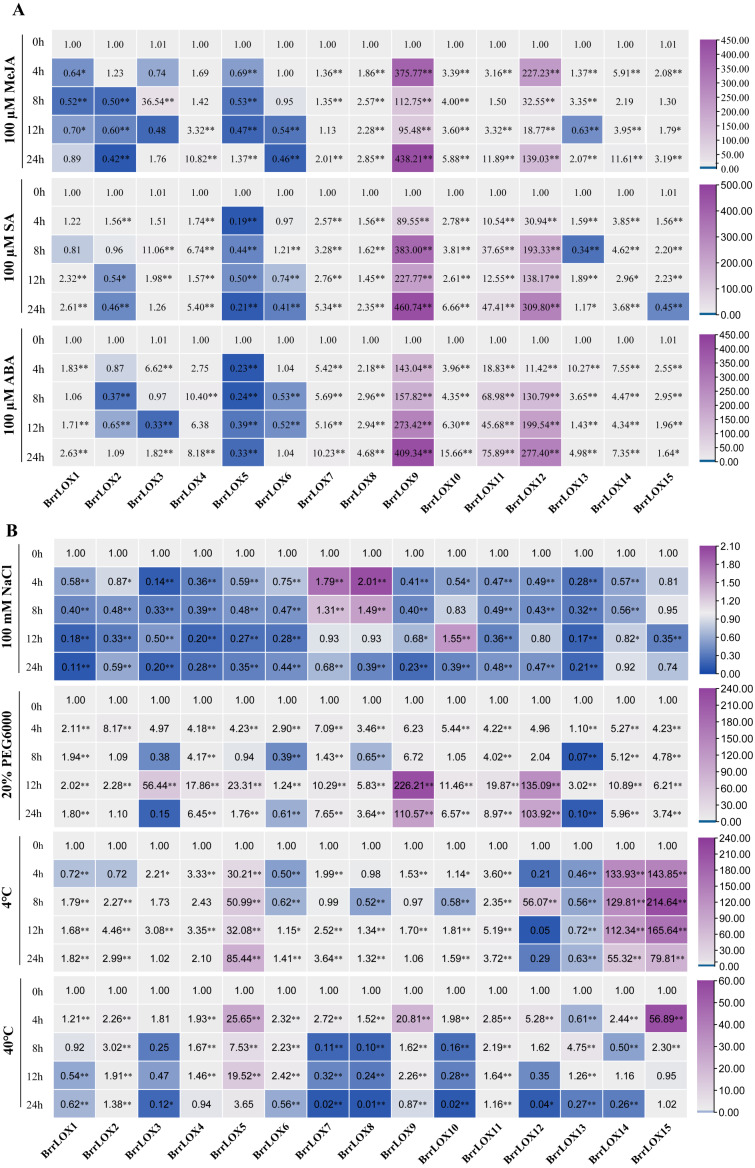
Figure 10. Expression analysis of BrrLOX family genes under (A) exogenous hormonal (MeJA, SA, and ABA) and (B) abiotic stress (NaCI, PEG6000, 4 °C and 40 °C) treatments.
The relative expression levels of BrrLOX genes in turnip leaves were analysed at 4, 8, 12 and 24 h of treatment and compared with their values at 0 h. The gene relative expression was calculated using the 2−ΔΔCT method with β-Actin as an internal reference, and values represent mean of three biological replicates. Purple indicates up-regulated expression levels, blue indicates down-regulated expression levels (* p < 0.05, ** p < 0.01, one-way ANOVA).

