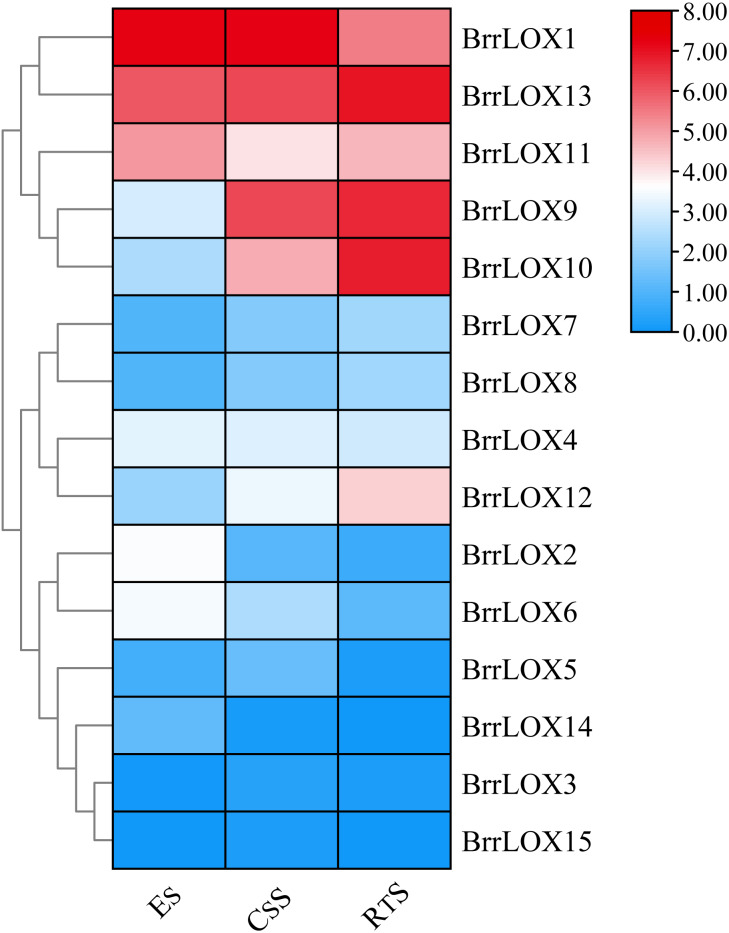
Figure 9. Expression of the BrrLOX gene family in the fleshy roots of turnips at different developmental stages.
The heat map was created based on publicly available turnip flesh root transcriptome data. In the heat map, the color bars represent the average of the TPM values of log-transformed BrrLOX genes in two biological replicate samples. Red represents high expression level, blue represents low expression level. ES, early stage before cortical division; CS, cortical division stage; RTS, secondary root thickening stage.

