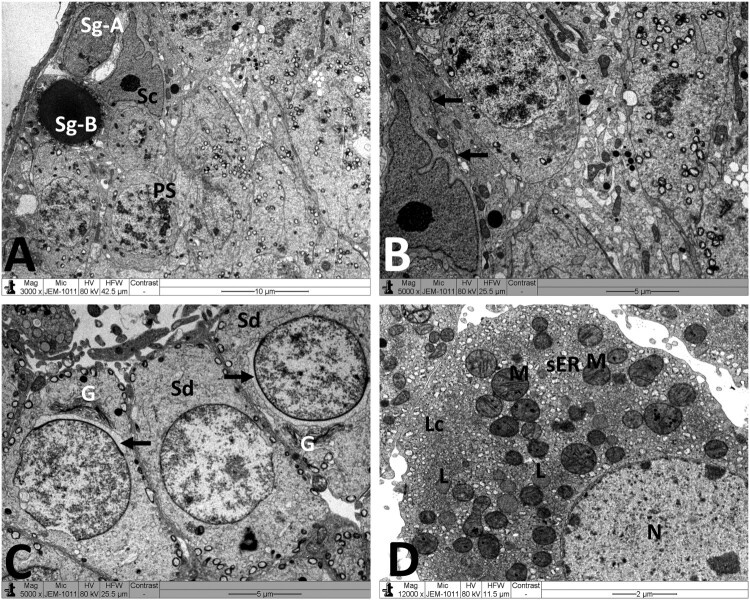
Figure 4.
Electron micrographs of testicular tissue from the control group. (A) Normal appearance of spermatogonia type A (Sg-A) and B (Sg-B), primary spermatocytes (PS) and Sertoli cell (Sc). (B) Higher magnification of Figure 3(A) showing Sertoli-Sertoli junctional complexes (arrows). (C) Round spermatids (Sd) at the phase of acrosomal formation. Arrow: acrosomal cap, G: Golgi apparatus. (D) Leydig cell (Lc) with nucleus (N) depicting fine granular chromatin and clear nuclear membranes, mitochondria (M), smooth endoplasmic reticula (sER) and lipid droplets (L). Scale bar: 10 µm (A), 5 µm (B, C), 2 µm (D).

