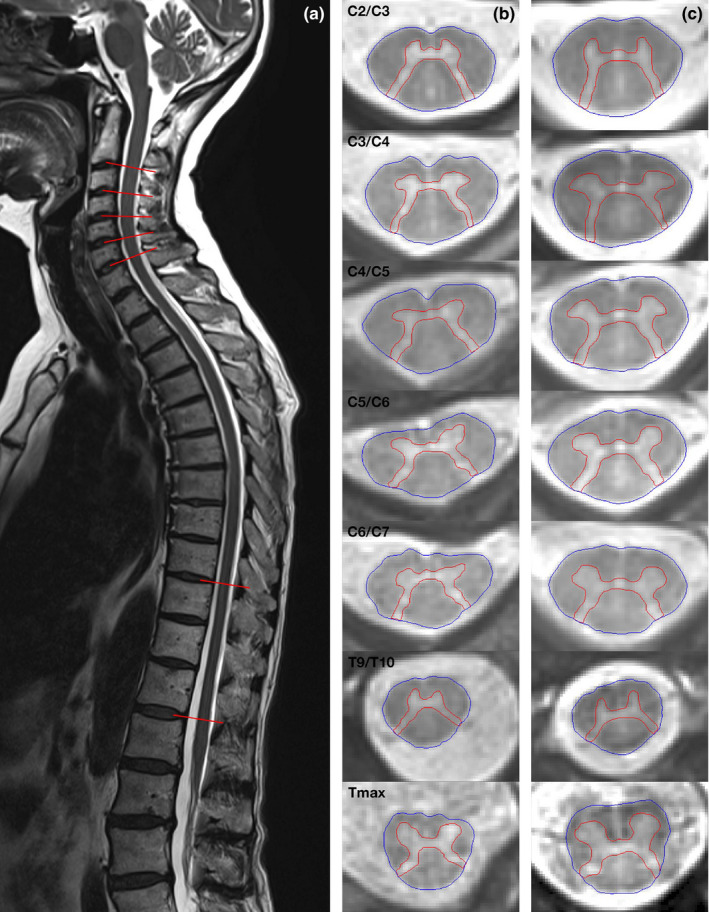
FIGURE 1.

Axial 2D‐rAMIRA (averaged magnetization inversion recovery acquisitions) images obtained at the intervertebral disc levels perpendicular to the spinal cord (as highlighted on the sagittal T2‐weighted image of a healthy control person (a)). Axial 2D‐rAMIRA images of a patient with post‐polio syndrome (b) and an age‐ and sex‐matched healthy control person (c) from top to bottom: C2/3, C3/4, C4/5, C5/6, C6/7, T9/T10 and T max (in‐plane resolution 0.5 × 0.5 mm2) [Colour figure can be viewed at wileyonlinelibrary.com]
