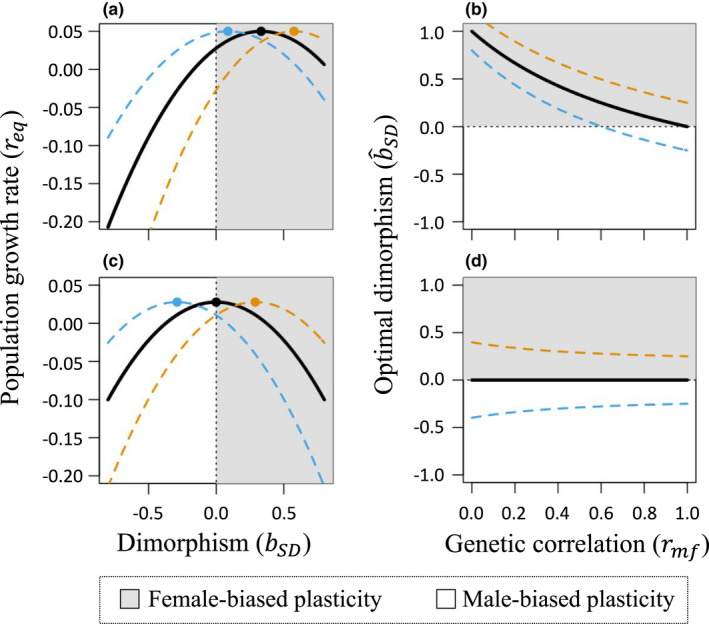
FIGURE 1.

Effects of sexual dimorphism in plasticity on the steady‐state intrinsic population growth () under directional change in the environment. Under female demographic dominance (panels a, b), female‐biased plasticity (bSD >0; shaded regions) typically promotes long‐run population growth. Curves are based on Equations ((1), (2)), with parameters: η = 0.05; (bf + bm )/2 = 0.5, r max = 0.05, (VA , f + VA , m )/2 = 0.5, (Bf + Bm )/2 = 1, and no cost of plasticity; rmf = 0.5 in panel (a), and rmf varies in panel (b). The black curves use Bf = Bm , VA , f = VA , m , and γ f = γ m ; orange curves use Bf –Bm = 0.2, VA , f –VA , m = −0.1, and γ f = γ m ; and blue curves use Bf –Bm = −0.2, VA , f –VA , m = 0.1, and γ f = γ m . Under demographic co‐dominance (i.e. where sexes contribute equally to population growth) (panels c, d), sex‐biased plasticity (bSD ≠ 0) tends to hinder population growth. Curves are based on Equation (3) in panel (c) and Equation (4) in panel (d), with the parameters to those in panels a, b. In all four panels, that shaded regions of the parameter space (bSD > 0) correspond to female‐biased plasticity, and unshaded regions bSD < 0) correspond to male‐biased plasticity
