Figure 3.

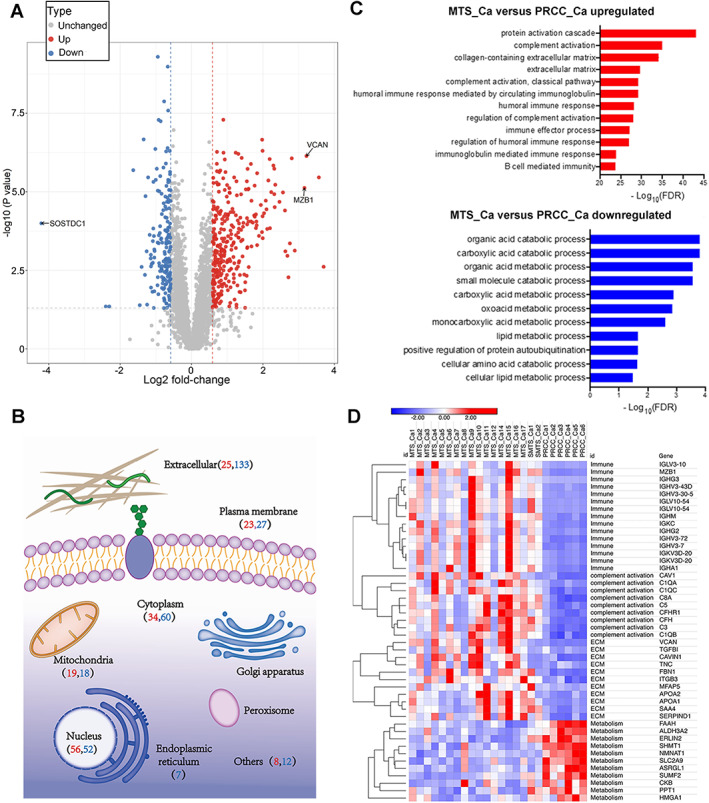
Comparison of MTSCC and PRCC tumor proteomics. (A) Volcano plot highlighting the differentially expressed proteins in MTS‐Ca versus PRCC‐Ca. (B) Subcellular location of the differentially expressed proteins in MTS‐Ca versus PRCC‐Ca (red numbers: number of upregulated proteins; blue numbers: number of downregulated proteins). (C) The differentially expressed proteins between MTS‐Ca and PRCC‐Ca were classified by GO annotation. (D) Heat map of differentially expressed proteins between MTS‐Ca and PRCC‐Ca.
