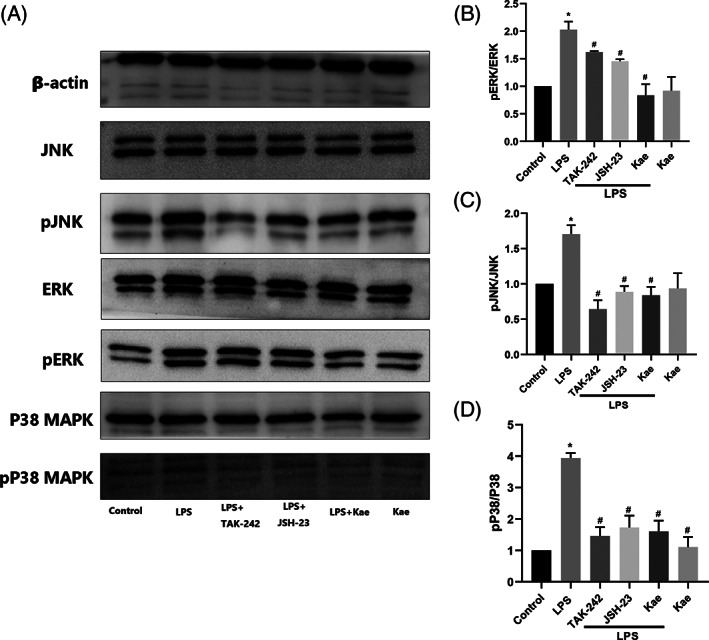
FIGURE 5.

Inhibitory effects of kaempferol on LPS‐induced JNK, ERK, and p38 MAPK activation in BV2 cells. (a–d) JNK, pJNK, ERK, pERK, p38 MAPK, and p p38 MAPK protein level measured by western blotting. n = 3,*p < .05 versus control group, and #p < .05 versus LPS group. One‐way ANOVA was used to determine the difference between groups
