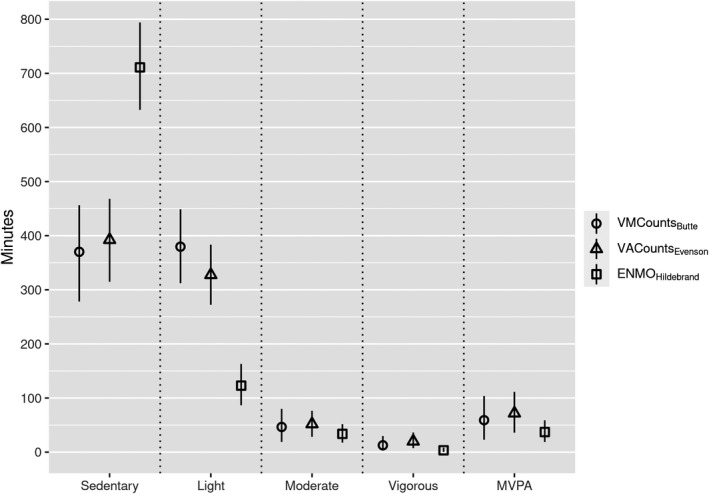
FIGURE 1.

Mean daily time spent (min) and standard deviations (error bars) in sedentary time and physical activity intensitites considering different cut‐points (N = 751). Cut‐points expressed in the legend with the acceleration metric used and the first author of the validation study in subscripts, that is, Butte et al. 10 , Hildebrand et al. 13 , 14 , and Evenson et al. 11 VMCounts: Vector magnitude counts; VACounts: Vertical axis counts; ENMO: Euclidean norm −1 g
