FIGURE 1.

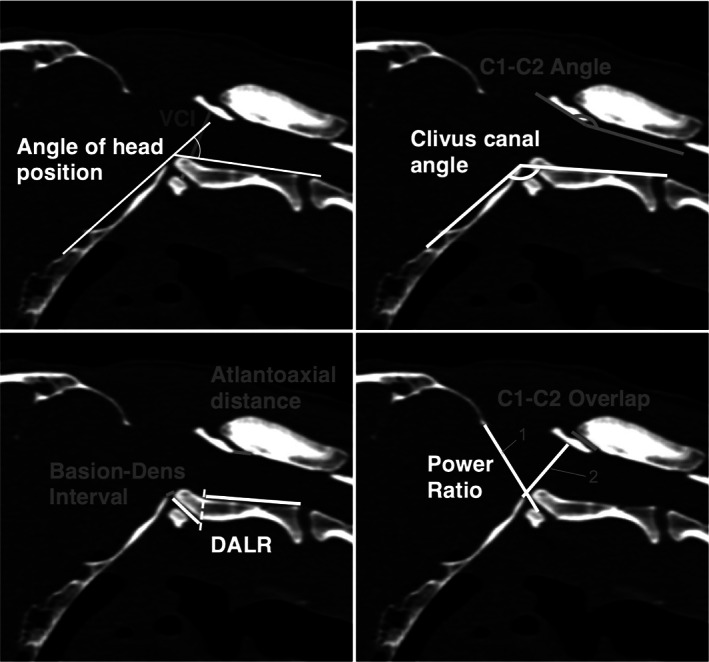
Overview of the quantitative imaging measurements. Opisthion‐C1 ventral arch interval (1) and basionQ15 C2 interval (2) to calculate the power ratio

Overview of the quantitative imaging measurements. Opisthion‐C1 ventral arch interval (1) and basionQ15 C2 interval (2) to calculate the power ratio