FIGURE 5.

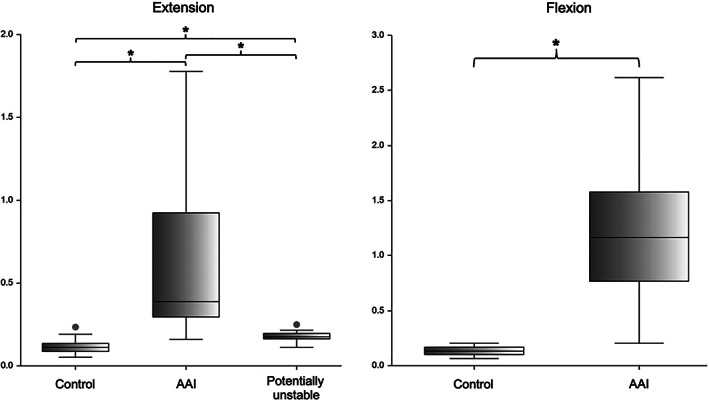
Box plot of the ventral compression index (VCI). The asterisk (*) over a brace indicates that both groups are significantly different. For every comparison done, P was .000001

Box plot of the ventral compression index (VCI). The asterisk (*) over a brace indicates that both groups are significantly different. For every comparison done, P was .000001