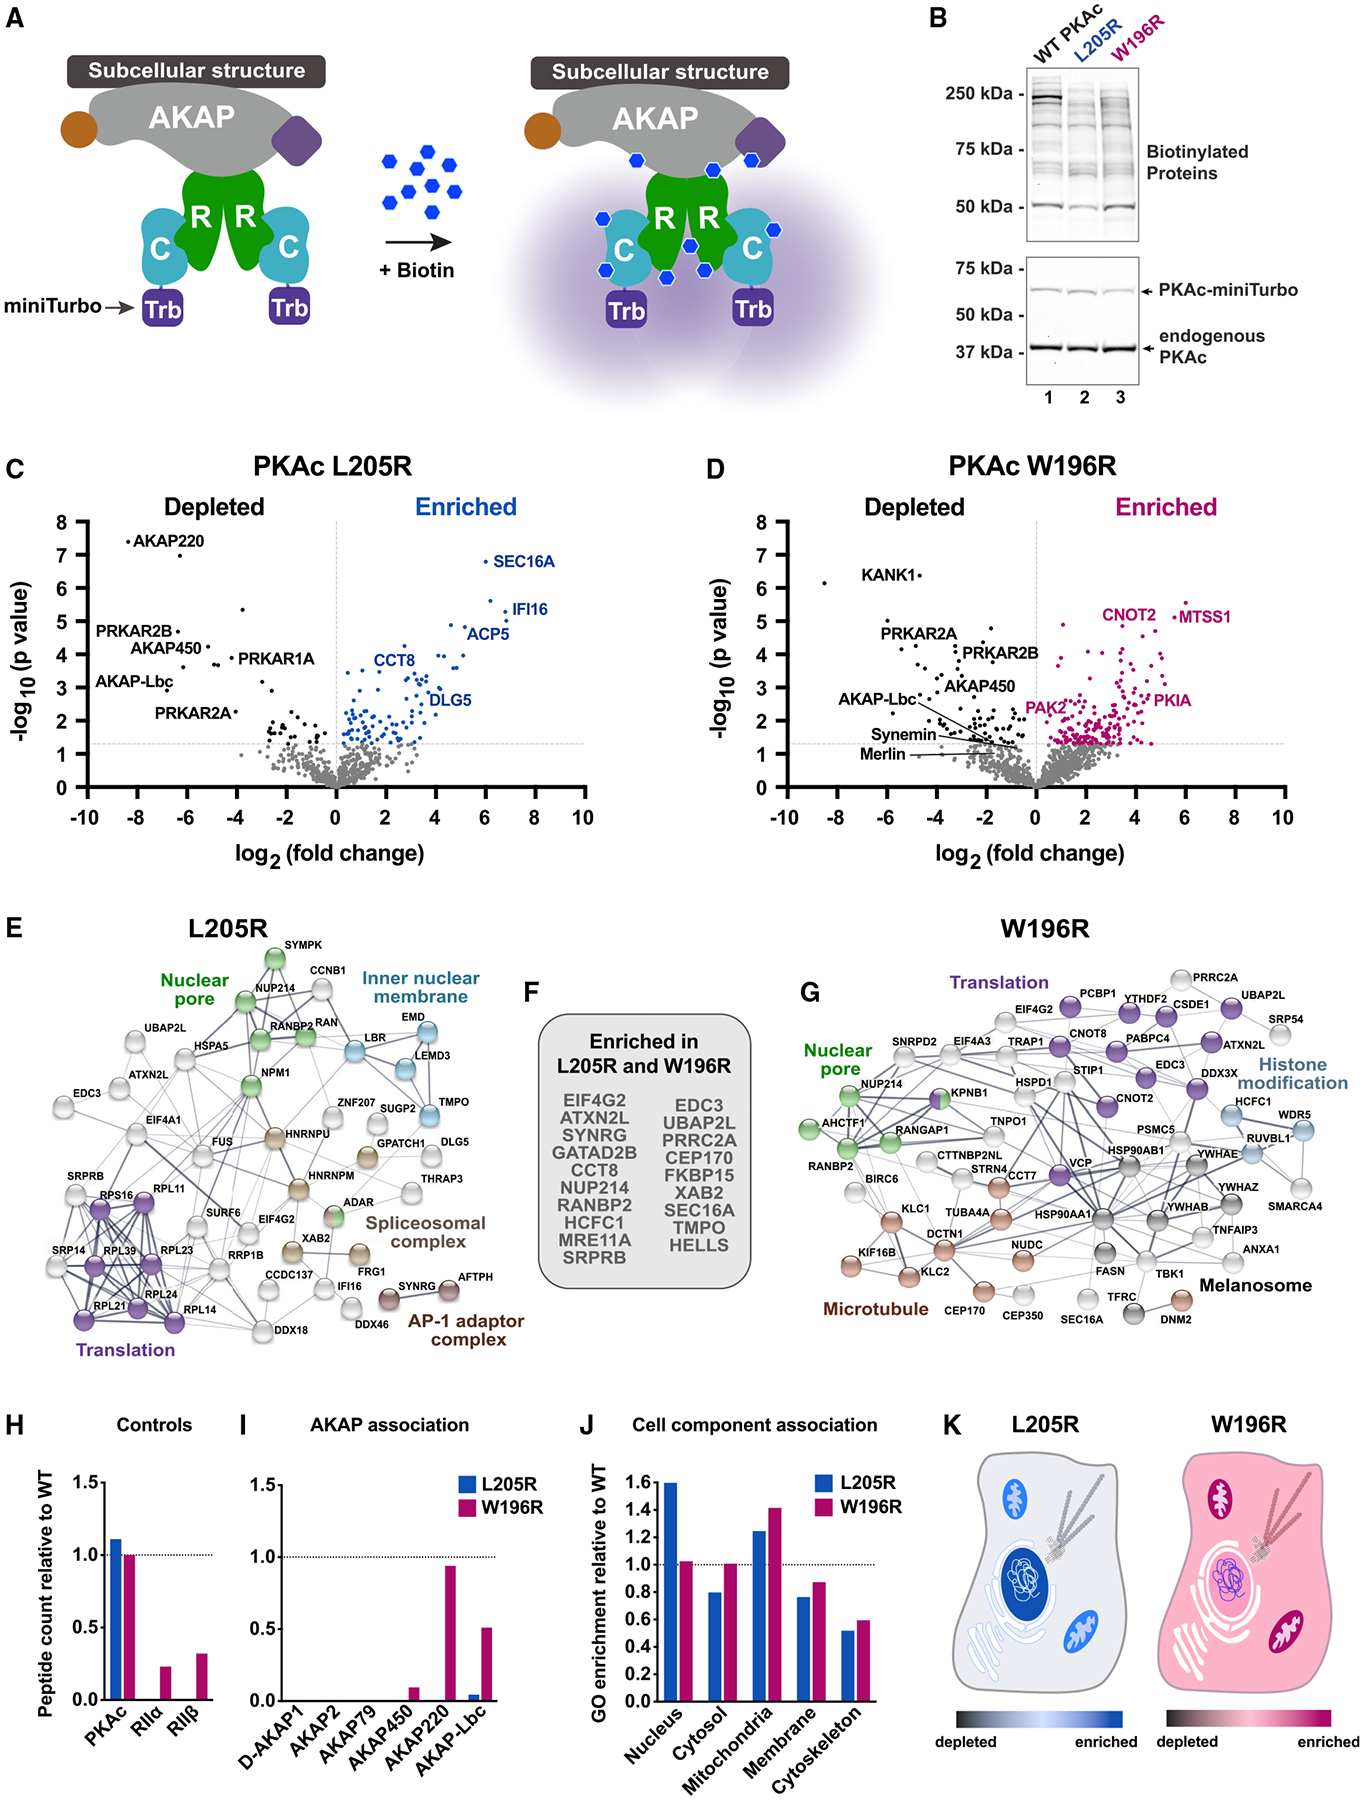
Figure 2. Proximity proteomics identify distinct associations among PKAc variants.

(A) Model of PKAc tagged with miniTurbo biotin ligase at an AKAP signaling island. Upon application of biotin, proteins in proximity (5–10 nm) to PKAc are biotinylated.
(B) Immunoblots of lysates from stable H295R lines after proximity biotinylation. Neutravidin-HRP signal (top) shows banding differences among conditions. PKAc signal (bottom) shows expression of tagged kinase at low levels versus endogenous PKAc.
(C and D) Volcano plots of proximity proteomics. Black, proteins underrepresented versus WT. Blue (L205R) and Red (W196R), proteins enriched in the mutant conditions. Gray, proteins with a corrected p value lower than 0.05. Four biological replicates.
(E–G) STRING network depictions of selected enriched proteins in L205R (E) and W196R (G). Between is a list (F) of proteins identified as enriched in both mutant conditions.
(H) Quantitation of association with PKA holoenzyme components.
(I) Association with AKAPs as determined by peptides identified versus WT condition.
(J) Gene ontology enrichment scores for cell component relative to WT.
(K and L) Graphical depictions of (J). See also Figure S2.
