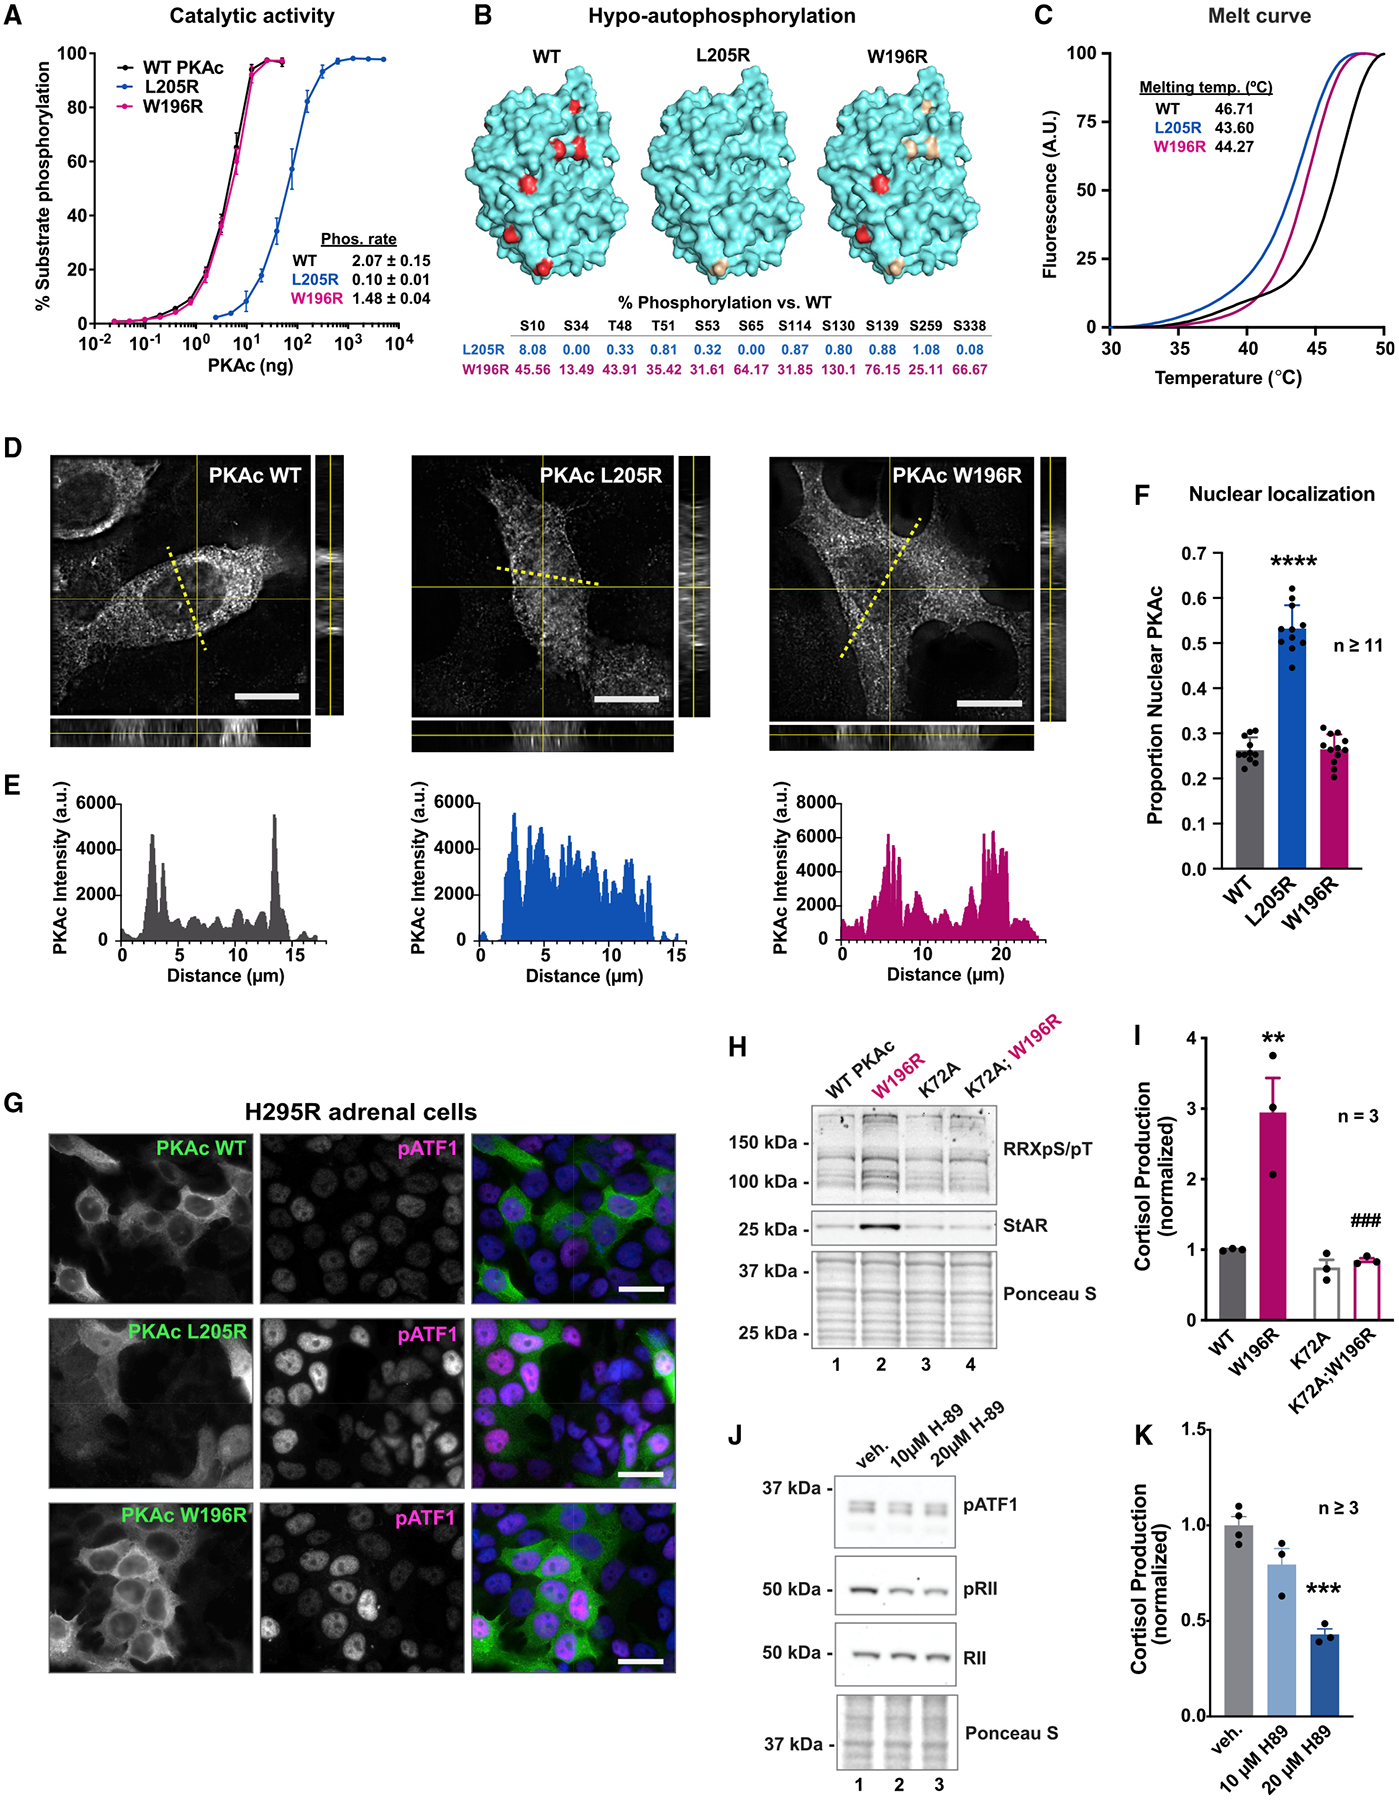
Figure 3. Cushing’s mutants exhibit distinct physiochemical profiles.

(A) Catalytic activity of recombinant WT and mutant PKAc toward a peptide substrate. Data are %substrate phosphorylation (mean ± SD) after 5 min; n = 4. Relative rates were determined per ng of enzyme as pmol phosphate incorporation per min. Calculated from assays containing 0.8 ng WT and W196R PKAc and 19.5 ng L205R at linear rates of phosphorylation.
(B) Structural depictions and quantification of relative abundance of phosphorylated sites compared with WT PKAc as measured by mass spectrometry. Red ≥66.7% WT levels. Gold, 1–66.6% WT levels; n = 3.
(C) Normalized thermal melt curves for WT and mutant PKAc.
(D) Orthogonal depictions of PKAc immunofluorescence in H295R cells. Side, zy planes; bottom, zx planes; scale bar, 10 μm.
(E) Line plots of PKAc signals in (D) as indicated by yellow dotted lines.
(F) Quantitation of line plots using DAPI signal to define nucleus; n ≥ 11; mean ± SE.****p ≤ 0.0001, one-way ANOVA with Dunnett’s correction.
(G) H295R cells expressing V5-tagged PKAc variants were stained for V5 and pATF1. Scale bar, 20 μm.
(H) Immunoblot of H295R lysates infected with PKAc variants as listed. Represents three replicate experiments.
(I) Cortisol measurements from H295R cells. Kinase activity is necessary for the mutant’s effect on cortisol production. Mean ± SE. **p ≤ 0.01 versus WT and ###p ≤ 0.001 versus W196R; one-way ANOVA with Sidak correction; n = 3.
(J) Immunoblot of H295R lysates after 1-h incubation with vehicle or H89. Represents three experimental replicates.
(K) Cortisol measurements from H295R cells after 1-h vehicle or H89. Mean ± SE. ***p ≤ 0.001, one-way ANOVA with Sidak correction. See also Figure S3.
