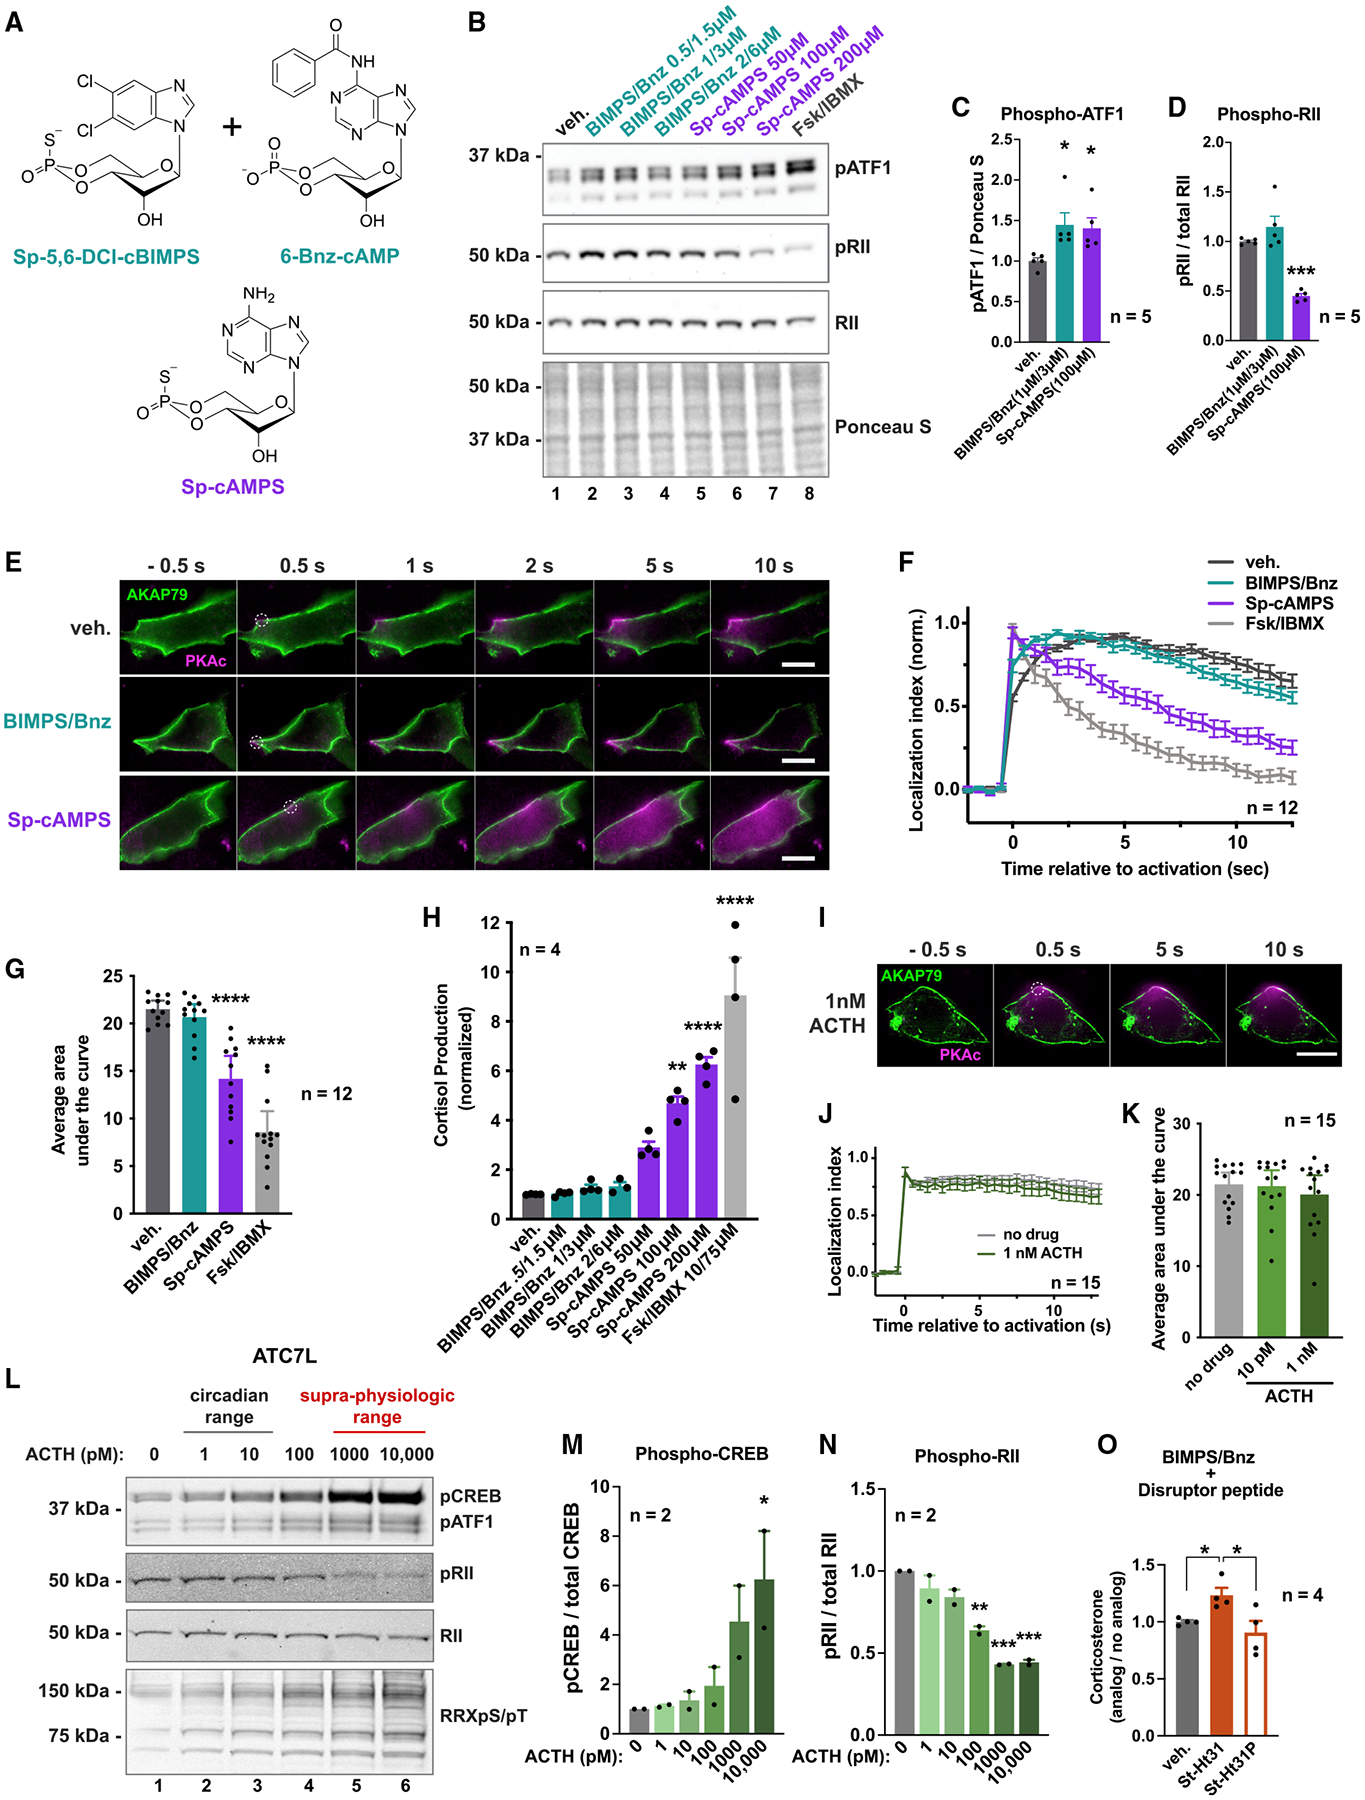
Figure 4. PKA activation is not sufficient for stress hormone overproduction.

(A) cAMP analogs used.
(B) Immunoblot of H295R lysates after 1 h with vehicle or increasing concentrations of PKA-activating drugs.
(C and D) Quantification of phospho-ATF1 signal normalized to total protein (C) and phospho-RIIβ signal divided by total RIIβ (D). Teal, 1 μM Sp-5,6-DCl-cBIMPS + μM 6-Bnz-cAMP. Purple, 100 μM Sp-cAMPS. Mean ± SE. *p < 0.05, one-way ANOVA with Holm-Sidak correction; n = 5.
(E) Photoactivation time course of H295R cells expressing AKAP79-YFP, RII-iRFP, and WT PKAc tagged with photoactivatable mCherry. Top, vehicle only; middle, 1 μM Sp-5,6-DCl-cBIMPS + 3 μM 6-Bnz-cAMP; bottom, 100 μM Sp-cAMPS. Scale bar, 10 μm.
(F) Amalgamated photoactivation data from three experimental replicates. Mean ± SE.
(G) Integration of values from (F). Mean ± SE. ****p ≤ 0.0001, one-way ANOVA with Dunnett’s correction.
(H) Cortisol measurements from H295R cells treated for 1 h with vehicle or increasing concentrations of PKA-activating drugs. Mean ± SE. ***p ≤ 0.001, ****p ≤ 0.0001, one-way ANOVA with Dunnett’s correction; n = 4.
(I) Photoactivation time course after exposure to 1 nM ACTH. Scale bar, 10 μm.
(J) Photoactivation quantitation of H295R cells with and without ACTH. Data from two experimental replicates. Mean ± SE.
(K) Integration of curves from (J). No significant differences by one-way ANOVA. Mean ± SE.
(L) Immunoblot of ATC7L cells after 1-h ACTH treatment.
(M and N) Quantification of (K). Phospho-CREB signal divided by total CREB (M) and phospho-RIIβ signal divided by total RIIβ (N). Mean ± SE. *p < 0.05, **p ≤ 0.01, ***p ≤ 0.001, one-way ANOVA with Holm-Sidak correction; n = 2 full dosage curves.
(O) Two-hour corticosterone production of ATC7L cells with no peptide (gray), stearated Ht31 (25 μM; filled orange) or proline-mutated stearated Ht31 (25 μM; open orange). Quantification normalizes hormone production after 2 μM Sp-5,6-DCl-cBIMPS/6 μM 6-Bnz-cAMP treatment to no analog treatment. Mean ± SE. *p < 0.05, one-way ANOVA with Holm-Sidak correction; n = 4. See also Figure S4.
