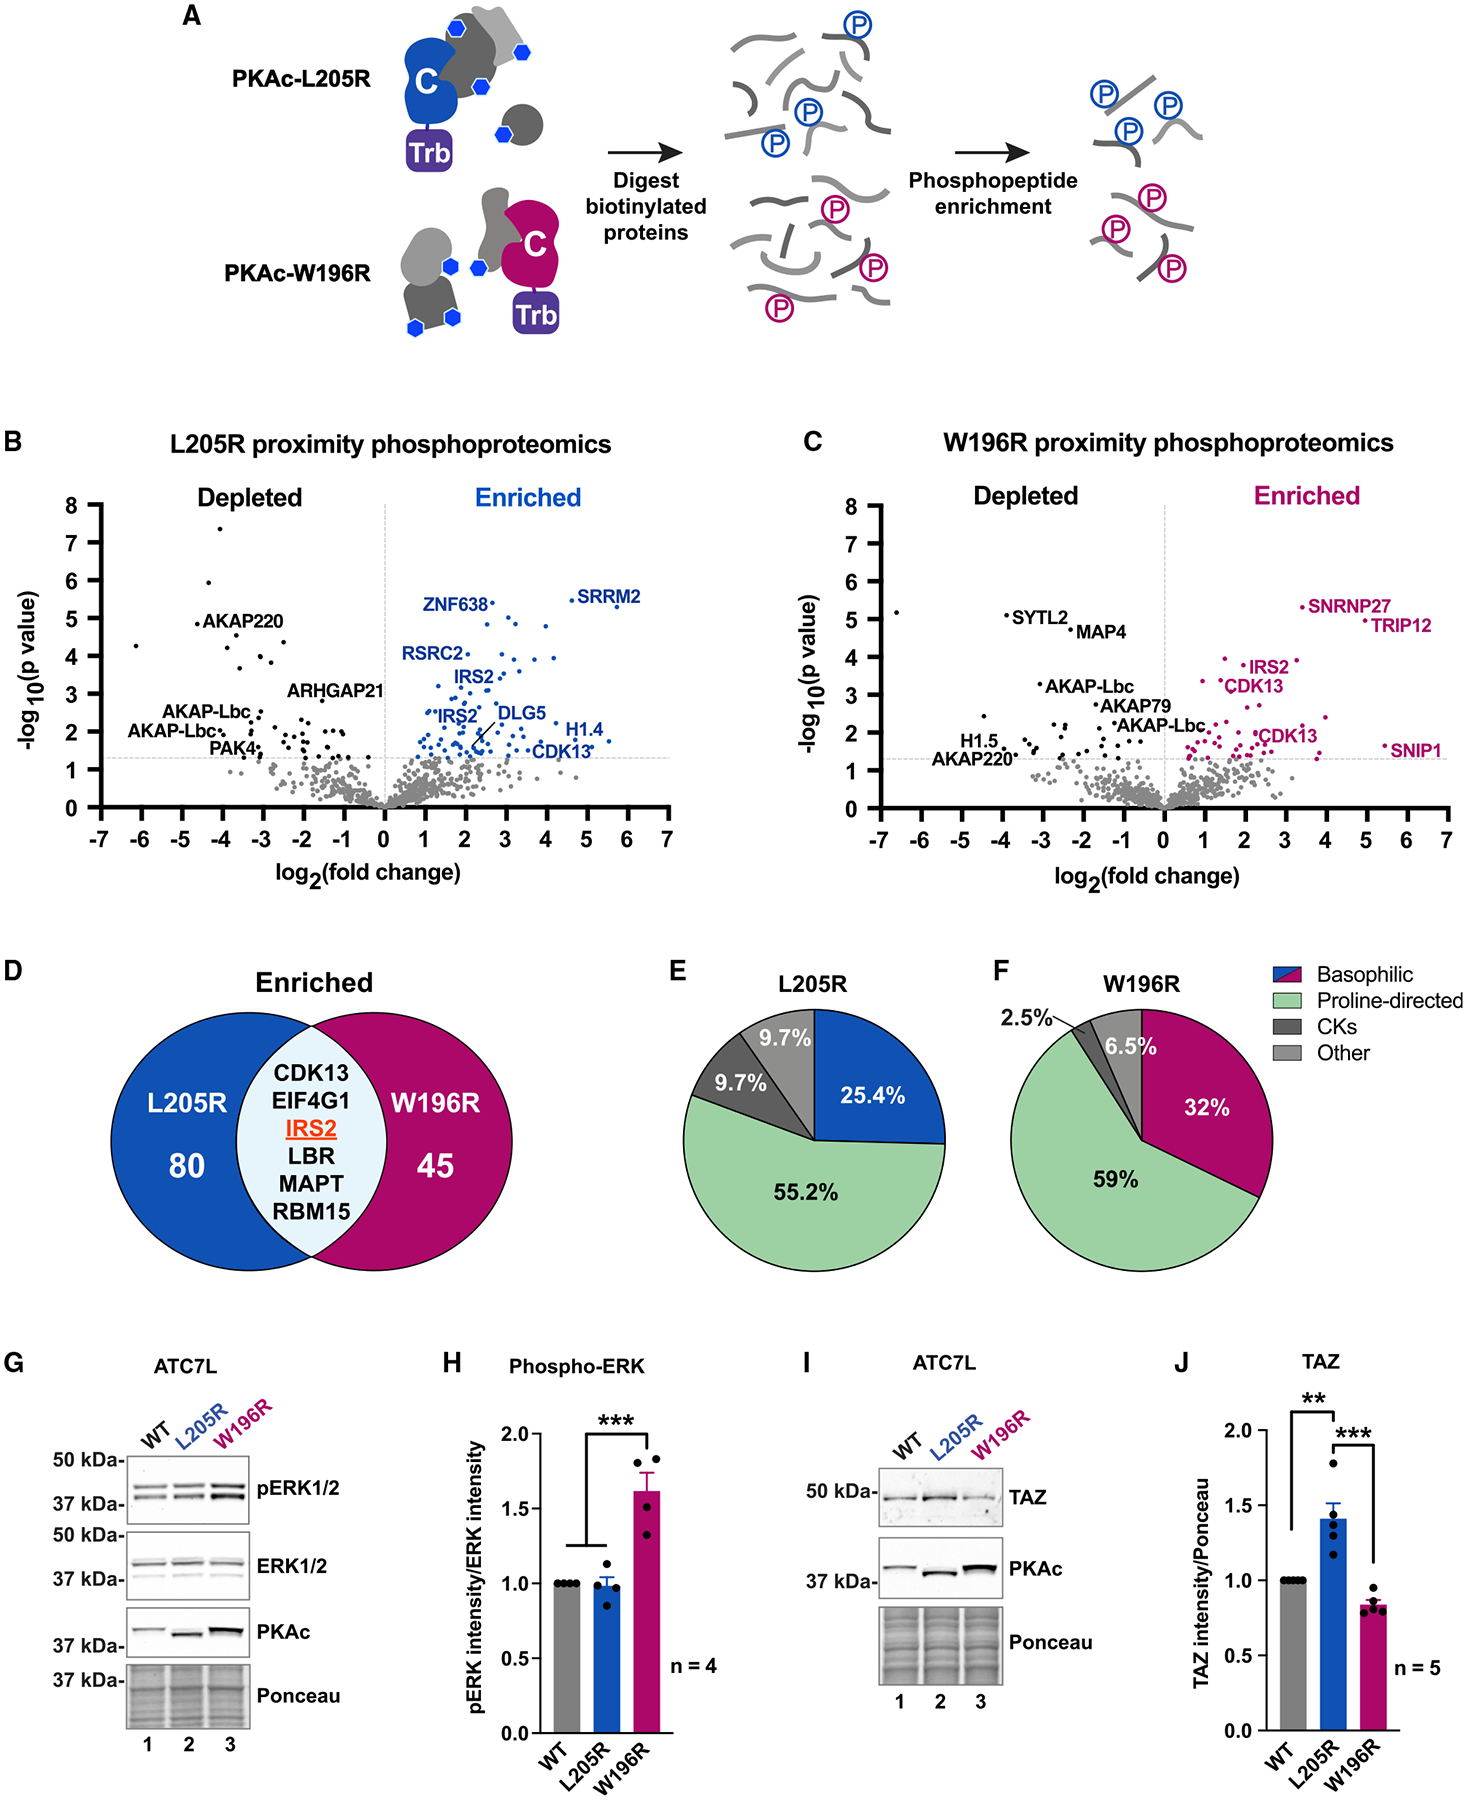
Figure 6. Proximity phosphoproteomic analyses reveal disruption of ERK and Hippo signaling.

(A) Locally biotinylated proteins are isolated, digested, and subjected to phosphoenrichment.
(B and C) Proximity phosphoproteomics of PKAc-miniTurbo-biotinylated H295R samples from L205R (B) and W196R (C) versus WT. Phosphopeptides depleted in the mutant conditions, black; enriched phosphopeptides, blue (L205R) or red (W196R).
(D) Venn diagram of significantly enriched phosphopeptides identified in mutant conditions.
(E and F) NetworKIN kinase prediction for phosphosites enriched in L205R (E) and W196R (F) conditions.
(G) Immunoblot of ATC7L cells expressing PKAc variants.
(H) Quantitation of (G). Mean ± SE. ***p ≤ 0.001, one-way ANOVA with Sidak correction; n = 4.
(I) Immunoblot of ATC7L cells expressing PKAc variants.
(J) Quantitation of (I). Mean ± SE. ***p ≤ 0.001, **p ≤ 0.01, one-way ANOVA with Sidak correction; n = 5. See also Figure S6.
