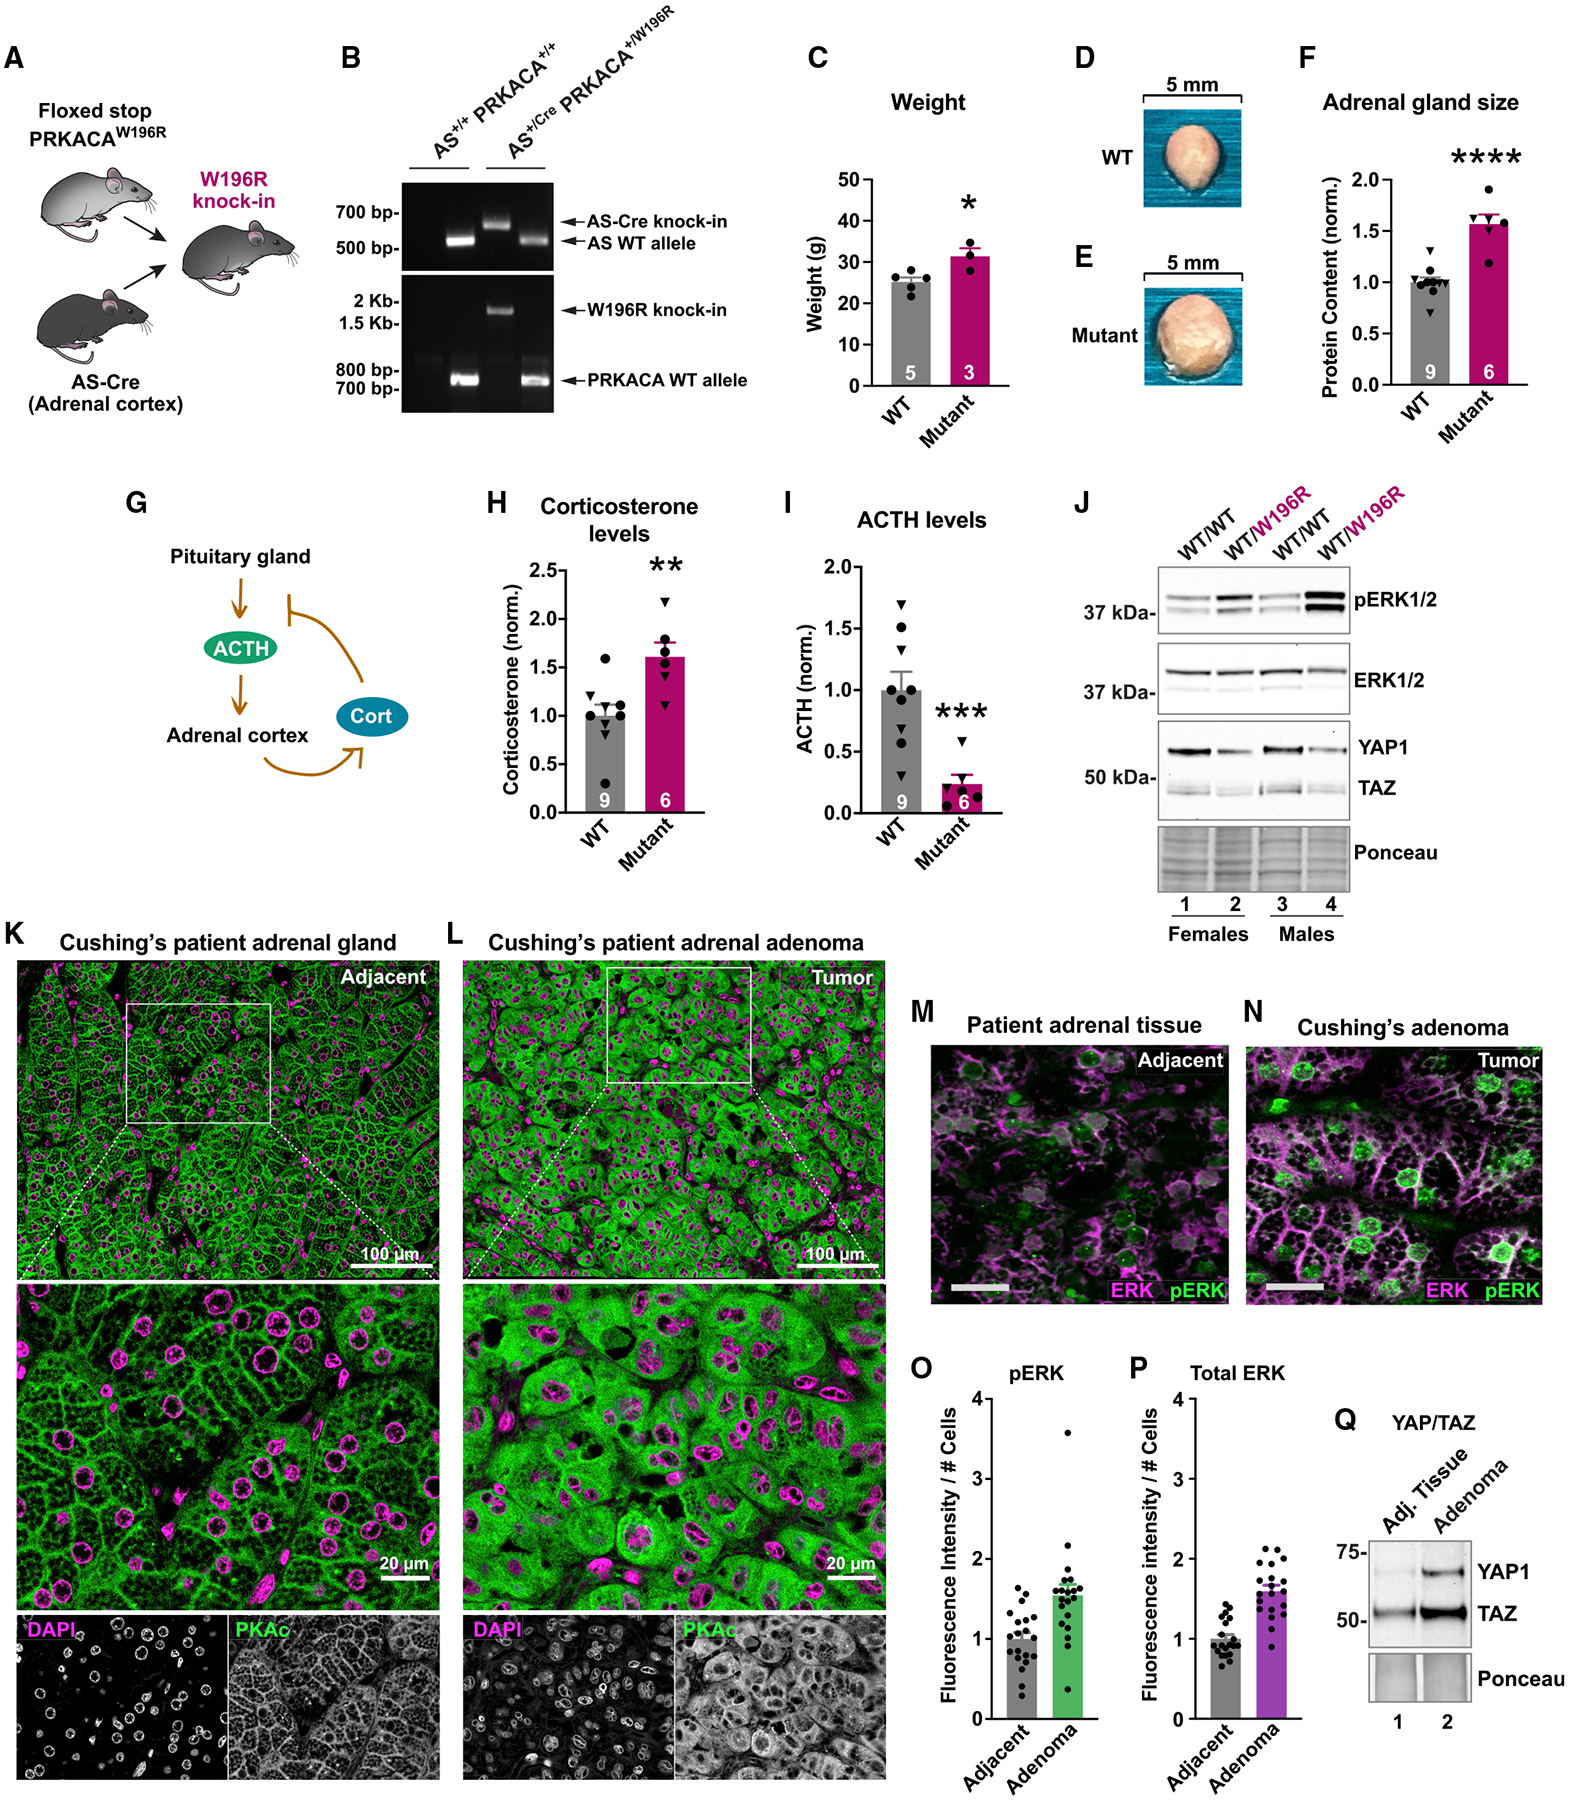
Figure 7. In vivo and clinical studies of Cushing’s PKAc mutants.

(A) Strategy to make a mouse with adrenal cortex-specific heterozygous expression of PKAc-W196R.
(B) Gel of genotyping PCR for littermate males.
(C) Weight of 1-year female mutant mice (red; n = 3) compared with littermate controls (gray; n = 5). Mean ± SE. *p ≤ 0.05 by Student’s t test.
(D and E) Images of adrenal glands from WT (D) and PKAc-W196R heterozygotes (E).
(F) Adrenal gland lysate protein concentration from male (triangles) and female (circles) mice. Mean ± SE. ****p ≤ 0.0001 by Student’s t test.
(G) Negative feedback mechanism wherein stress hormone downregulates ACTH.
(H and I) Serum corticosterone (H) and ACTH (I) levels from male (triangles) and female (circles) mice. **p ≤ 0.01 and ***p ≤ 0.001 by Welch’s t test. Mean ± SE.
(J) Immunoblot of adrenal gland lysates from female (lanes 1 and 2) and male (lanes 3 and 4) littermate mice.
(K and L) Resected tissue from a Cushing’s patient. PKAc (green) and DAPI (magenta) were stained in normal adjacent adrenal tissue (K) and adenoma (L). (M and N) Immunostaining for ERK (magenta) and phospho-ERK (green) in adjacent adrenal gland
(M) and adenoma (N) of a Cushing’s patient. Scale bar, 20 μm.
(O and P) Quantitation of fluorescence for phospho-ERK (O) and total ERK (P). Ten images each per condition from two patients. Mean ± SE.
(Q) Immunoblot detecting YAP1 and TAZ levels in normal adrenal and adenoma from a Cushing’s patient. Represents two patients. See also Figure S7.
