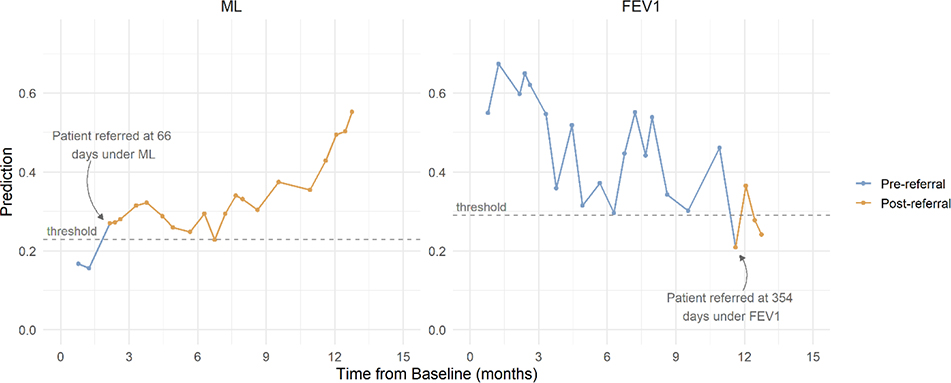
Figure 2: Patient trajectory and referral example.
Risk of 2-year mortality from the ML model and FEV1 % predicted for an example patient at each clinic visit. For the ML model, a patient is referred at the first visit where risk exceeds the threshold, denoted by a change in line color. For FEV1, referral occurs at the first visit where FEV1 is lower than 30%, denoted by a change in line color.

