
Figure 4.
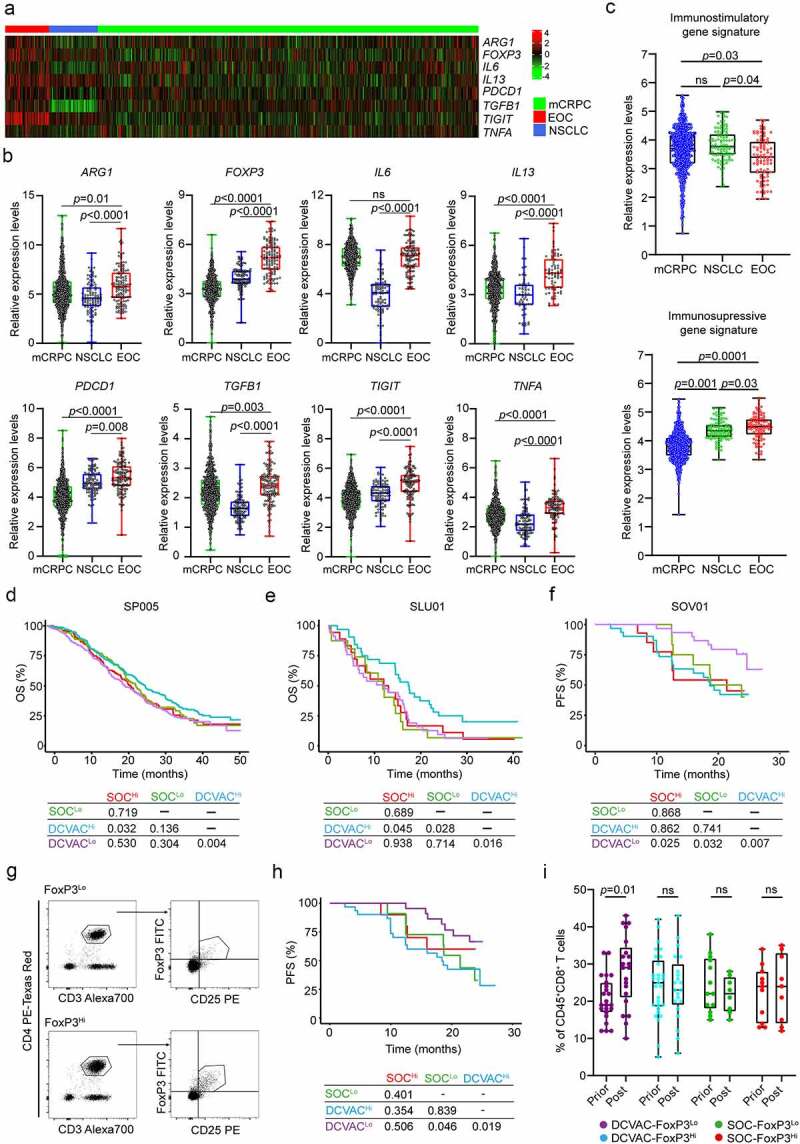
High frequency of regulatory T cells in peripheral blood of EOC patients is associated with poor response to DCVAC therapy. (a) Heat map and (b) relative expression levels of the differentially expressed genes (DEGs) ARG1, FOXP3, IL6, IL13, PDCD1, TGFB1, TIGIT and TNFA in pre-treatment peripheral blood samples among mCRPC, NSCLC, and EOC patients in SP005, SLU01, and SOV01. (c) Relative expression levels of immunostimulatory (CD8A, GNLY, GZMA, GZMB, IFNG, IL12A, PRF1, TBX21) and immunosuppressive (FOXP3, HAVCR2, IDO1, IL10, LAG3, PDCD1, TGFB1, TIGIT) gene signatures in mCRPC, NSCLC and EOC patients in SP005, SLU01, and SOV01. (d, e) OS of 804 mCRPC (d) and 103 NSCLC (e) patients following stratification by the median expression of the immunostimulatory-like gene signature and study arm. (f) PFS of 93 EOC patients following stratification by the median expression of the immunosuppressive-like gene signature and study arm. Survival curves were estimated using the Kaplan–Meier method, and differences between groups were evaluated using the log-rank test. The numbers of patients at risk and p values are reported. (g) Representative dot plots for CD4+CD25+FoxP3+ regulatory T cells in low and high EOC patients in SOV01. (h) PFS of EOC patients treated with SOC or DCVAC stratified by the median percentage of CD4+CD25+FoxP3+ regulatory T cells in peripheral blood. Survival curves were estimated using the Kaplan–Meier method, and differences between groups were evaluated using the log-rank test. (i) Percentage of CD8+ T cells in peripheral blood of SOC FoxP3Lo, SOC FoxP3Hi, DCVAC FoxP3Lo and DCVAC FoxP3Hi patients prior and post DCVAC therapy. Statistical significance was calculated by the Wilcoxon test. p values are indicated.