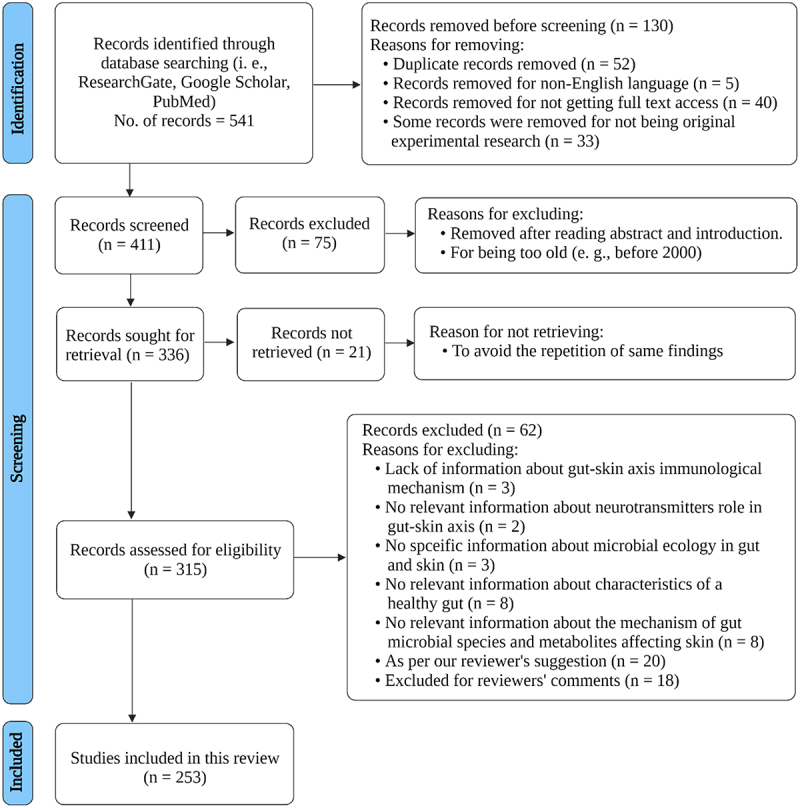
Figure 1.

Prisma flowchart. This diagram represents the Prisma flowchart and demonstrates database searching, screening, excluding, retrieval, and eligibility findings for the final full-text studies used in this review. This illustration is based on17 and created with BioRender.com (2022).
