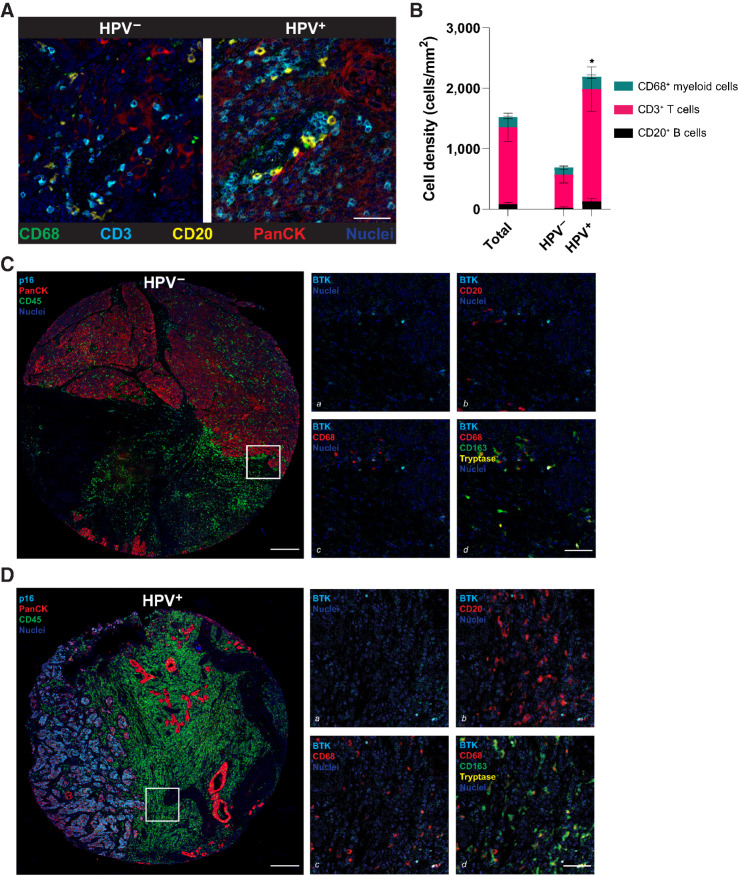
Figure 1.
Immune cell abundance in HPV− and HPV+ HNSCC tumors. A, Pseudocolored images from mIHC staining of representative HPV− and HPV+ HNSCC tumors, indicating neoplastic (PanCK+) and immune (CD68, CD3, and CD20) cell lineages. B, Quantitation of CD68+ myeloid cell (CD45+CD3/CD20/CD56−CD66b−Tryptase−CD68+CSF1R+CD163+/−), CD3+ T cell (CD45+CD3+), and CD20+ B cell (CD45+CD3−CD56−CD20+) abundance in all HNSCC samples evaluated (left bar, “total”) and stratified by HPV status: HPV− (n = 17) and HPV+ (n = 21) HNSCCs. Stacked bars indicate mean ± SEM. Asterisks, P < 0.05 for CD3+ T cell abundance (pink). Pseudocolored images showing BTK immunoreactivity and co-expression with lymphoid and myeloid lineage markers in HPV− (C) and HPV+ (D) HNSCC. Low-magnification images at left show representative tissue microarray cores showing location of HPV− (p16−) and HPV+ (p16+; cyan) neoplastic (PanCK+; red) cells in proximity to immune cell (CD45+; green) infiltrates. Higher magnification regions (boxed area from left panels shown at higher magnifications on right) show BTK positivity (a, cyan) alone, in addition to CD20 (b, red), CD68 (c, red), and together with CD68 (red), CD163 (green), and Tryptase (yellow; d). Co-localization of BTK staining with CD163 and mast cell tryptase staining (d) is evident. BTK, Bruton's tyrosine kinase; HNSCC, head and neck squamous cell carcinoma; HPV, human papillomavirus; PanCK, pan-cytokeratin; SEM, standard error of the mean.

