Figure 6.
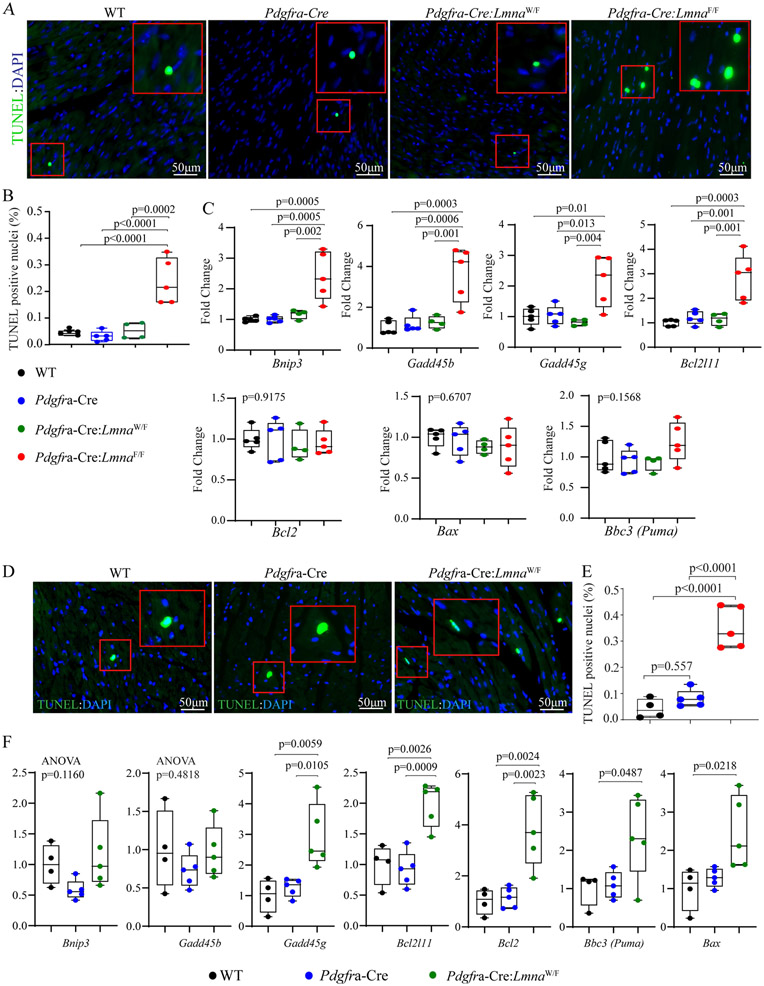
Myocardial apoptosis. (A) The three panels show thin myocardial sections stained for the TUNEL assay. The inserts show a high magnification view of the selected areas marked with a red box. The data are from six weeks old mice. (B) Quantitative data showing the percentages of the TUNEL positive cells in the experimental and control groups at six weeks of age. (C) Transcript levels of selected markers of apoptosis, quantified by RT-PCR, in the control and the experimental groups. (D) Thin myocardial sections were stained for the TUNEL assay in the one-year-old Pdgfra-Cre:LmnaW/F and control mice. (E) Quantitative data showing an increased number of nuclei stained positive for the TUNEL assay in the one-year Pdgfra-Cre:LmnaW/F mice, as compared to the WT and the Pdgfra-Cre mice. (F) Transcript levels of selected markers of apoptosis, showing increased levels of the selected genes in the one-year-old Pdgfra-Cre:LmnaW/F mice, as compared to the control groups.

