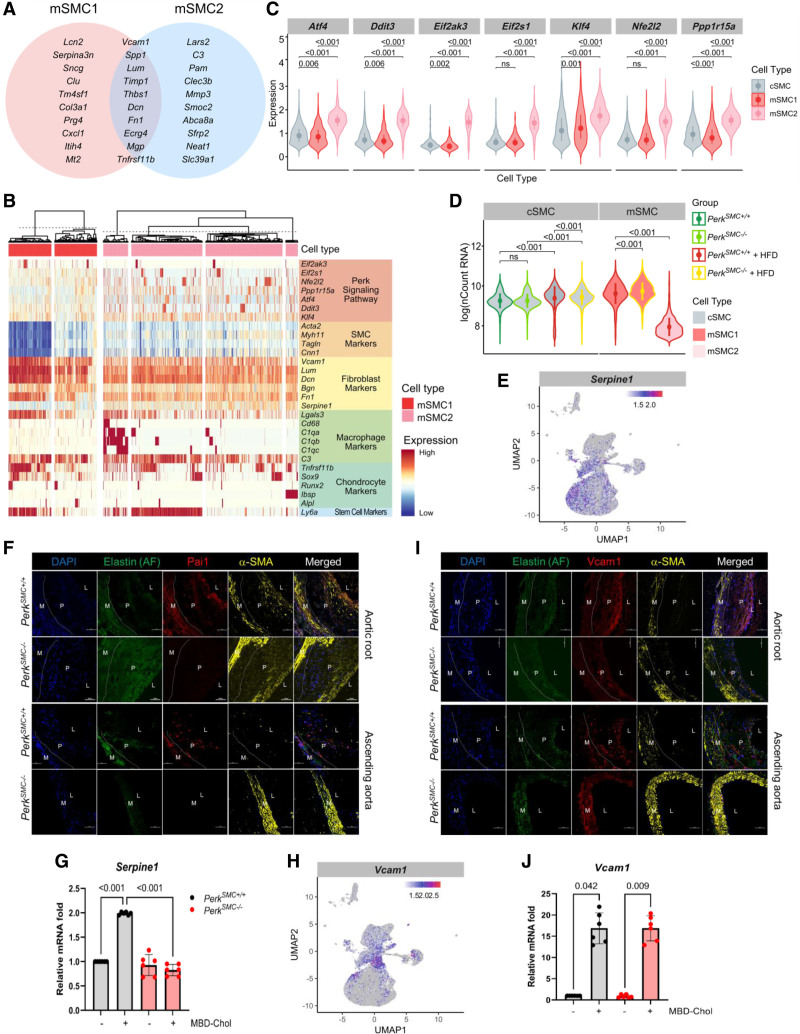
Figure 4.
Transcriptomic differences between the mSMC1 and mSMC2 clusters identify changes in global transcript levels and increased Perk signaling in mSMC2 cells. A, The top 20 genes upregulated in the mSMC1 and mSMC2 clusters show substantial overlap. B, Heatmap compares expression of Perk targets, contractile genes, fibromyocyte markers, macrophage and complement pathway markers, and osteogenic markers between mSMC1 and mSMC2. C, Compared with cSMCs and mSMC1 cells, mSMC2 cells show significantly increased expression of Perk targets (only cells that had detectable expression of the concerned genes were included in the analysis). D, mSMC2 cells have significantly decreased mRNA transcripts when compared with cSMCs in both genotypes with and without hyperlipidemia and HFD as well as mSMC1 cells in both genotypes. E, Serpine1 shows higher expression in mSMC2 than mSMC1. F, Pai1+ mSMC2 cells were abundant in the media and the lesions in both the aortic root and the ascending aortas of control mice and quite rare in those of PerkSMC−/− mice. G, Expression of Serpine1 is dependent on Perk. H, Vcam1 expression is significantly higher in mSMC1 compared with mSMC2. I, Vcam1 immunostaining in the aortic root in the PerkSMC+/+ and PerkSMC−/− aortas identified staining in the plaques, but more intense staining was present in cells in the fibrous cap of the PerkSMC+/+ aortas. In the ascending aortas, Vcam1+ staining cells were in the plaque in the PerkSMC+/+ mice, but stronger Vcam1 staining was observed in the cells the medial layer of PerkSMC−/− mice. J, Cholesterol-induced upregulation of Vcam1 is independent of Perk. All qPCR data were analyzed by Kruskal-Wallis test followed by Dunn multiple comparisons test. Data are represented as mean±SD. AF indicates autofluorescence; L, lumen; M, medial layer; and P, plaque.

