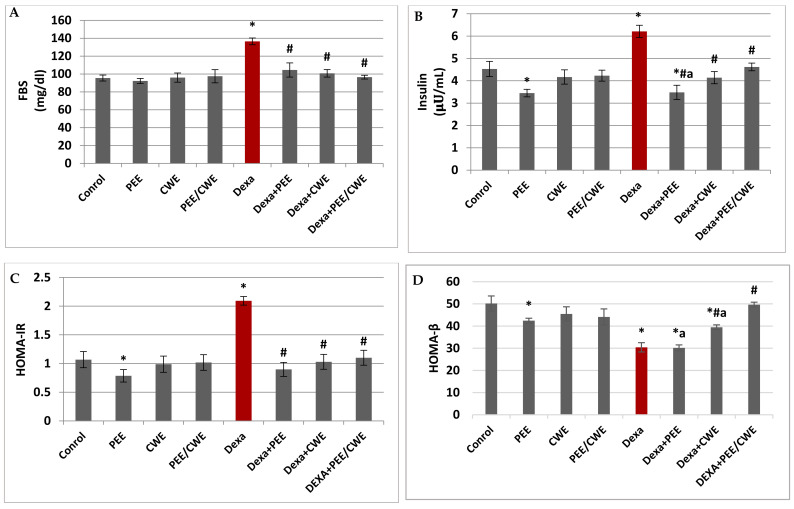
Figure 3.
The effects of different treatments on serum glycemic markers. (A) Fasting blood glucose (FBG). (B) Insulin level. (C) HOMA-IR. (D) HOMA-β. Data are expressed as the mean ± SD of six rats. Two-way analysis of variance (ANOVA) was used, followed by Tukey’s post hoc test (* p < 0.05 vs. control group, # p < 0.05 vs. Dexa group, and a p < 0.05 vs. DEXA + PEE + CWE group).

